Full Report
The numbers behind PT Japfa Comfeed Indonesia Tbk: as-reported financial statements and company metrics for FY2021–FY2025, traced to the source filings, opened with the share-price history those statements have to justify. Every linked figure opens the exact page of the filing it was printed on, with the statement row highlighted. Amounts in Rp millions unless noted.
Reading notes: All figures are in millions of Rupiah, as printed in the audited consolidated financial statements ('Disajikan dalam jutaan Rupiah'). Basic EPS is in full Rupiah per share. FY2021–FY2025 core statements are cited to each year's own audited annual report (its primary column). The bilingual (Indonesian/English) statements are the source; citation quotes use the printed Indonesian row label plus the figure. FY2016–FY2020 long-term figures are from the standardized data feed (data/financials, sourced from JPFA's audited December-31 filings) and are shown without page links. The numeric feed's 'net_income' equals profit attributable to owners of the parent (e.g. FY2025 Rp4,003,999 million), not total profit for the year (FY2025 Rp4,281,329 million, incl. non-controlling interests). The income statement shows both lines.
Share Price — Available History Since February 2026
The stock closed at IDR 2,210 on Aug 03, 2026 — down 17% over the window shown, trading between IDR 1,780 and IDR 2,790.
Source: market price feed, daily closes, Feb 2026–Aug 2026 — the feed marks this available history as partial. Price return only, excludes dividends.
Market capitalization IDR 25.70tn.
Market cap = 11.63B shares outstanding × the Aug 03, 2026 close of IDR 2,210. Market-derived, shown without filing links.
FY2025 at a Glance
Revenue (Rp millions)
Net income (Rp millions)
Source: FY2025 consolidated statements [1] [2] [3] [4]. Click any linked figure to open the filing page with the row highlighted.
Revenue by Business Segment (External Sales)
| Revenue by Business Segment (External Sales) | FY2021 | FY2022 | FY2023 | FY2024 | FY2025 |
|---|---|---|---|---|---|
| Animal Feed | 12,722,206 | 13,571,971 | 13,442,305 | 14,297,648 | 14,941,129 |
| Poultry Breeding | 2,563,384 | 2,422,047 | 2,267,695 | 3,132,714 | 3,427,753 |
| Commercial Farm | 17,601,351 | 18,958,652 | 21,296,709 | 23,034,835 | 24,455,203 |
| Poultry Processing and Consumer Products | 5,927,665 | 7,048,557 | 7,498,770 | 8,394,232 | 10,072,301 |
| Aquaculture | 3,914,476 | 4,718,364 | 4,557,685 | 4,749,962 | 5,096,728 |
| Trading and Others | 1,987,236 | 2,078,655 | 1,959,049 | 2,065,231 | 2,275,473 |
| Total External Sales | 44,716,318 | 48,798,246 | 51,022,213 | 55,674,622 | 60,268,587 |
Source: Segment Information note — external sales by segment; external + related-party sales reconcile to consolidated net sales [5] [6] [7] [8]. Click any linked figure to open the filing page with the row highlighted.
Income Statement
Source: Consolidated Statement of Profit or Loss and Other Comprehensive Income [1] [2] [3] [4]. Click any linked figure to open the filing page with the row highlighted.
Columns marked E are consensus analyst estimates from S&P Capital IQ (CapIQ), shown alongside reported results for direct comparison; they are not company guidance.
Estimate source: S&P Capital IQ (CapIQ) consensus, as of 2026-08-03. Estimate figures are S&P Capital IQ consensus (vendor data — no filing page links). EPS and net income use the normalized (adjusted) consensus where the street reports it. Consensus revenue sits well below the as-reported line for the last actual year — analysts often model a narrower revenue basis (e.g. net of interest or pass-through costs), so compare trends, not levels. Line-item analyst models (segments, drivers, KPIs) are in the Visible Alpha tab.
Balance Sheet
Source: Consolidated Statement of Financial Position [9] [10] [11] [12]. Click any linked figure to open the filing page with the row highlighted.
Cash Flow
| Cash Flow | FY2021 | FY2022 | FY2023 | FY2024 | FY2025 |
|---|---|---|---|---|---|
| Net Cash Provided by Operating Activities | 701,246 | 1,426,749 | 2,371,932 | 4,860,422 | 5,012,140 |
| Additions of Fixed Assets (Capex) | (1,291,356) | (2,082,379) | (2,017,574) | (1,629,680) | (2,467,498) |
| Net Cash Used in Investing Activities | (2,525,308) | (2,190,219) | (2,104,425) | (1,673,130) | (2,826,164) |
| Payments of Dividends | (488,899) | (724,969) | (581,016) | (818,937) | (862,196) |
| Net Cash Provided by (Used in) Financing Activities | 1,567,012 | 1,406,181 | (555,687) | (3,389,406) | (35,412) |
| Net Increase (Decrease) in Cash and Cash Equivalents | (257,050) | 642,711 | (288,180) | (202,114) | 2,150,564 |
| Cash and Cash Equivalents at End of Year | 1,085,116 | 1,811,082 | 1,502,603 | 1,353,714 | 3,550,006 |
| Free cash flow, derived | (590,110) | (655,630) | 354,358 | 3,230,742 | 2,544,642 |
Source: Consolidated Statement of Cash Flows [13] [14] [15] [16]. Click any linked figure to open the filing page with the row highlighted.
Segment Results (Profit by Business Segment)
| Segment Results (Profit by Business Segment) | FY2021 | FY2022 | FY2023 | FY2024 | FY2025 |
|---|---|---|---|---|---|
| Animal Feed | 1,900,435 | 2,614,333 | 2,740,265 | 2,375,999 | 3,129,056 |
| Poultry Breeding | 1,721,561 | 1,111,572 | 236,975 | 1,378,319 | 1,266,750 |
| Commercial Farm | (342,477) | (744,069) | (611,439) | 1,588,976 | 1,796,434 |
| Poultry Processing and Consumer Products | 241,667 | 238,752 | 417,242 | 371,638 | 441,577 |
| Aquaculture | 201,792 | 298,750 | 218,726 | 357,712 | 521,707 |
| Trading and Others | 317,980 | 305,777 | 256,823 | 276,724 | 370,751 |
| Total Segment Results (before elimination) | 4,040,958 | 3,825,115 | 3,258,592 | 6,349,368 | 7,526,275 |
Source: company filings [5] [6] [7] [8]. Click any linked figure to open the filing page with the row highlighted.
Profitability Returns (as reported)
| Profitability Returns (as reported) | FY2021 | FY2022 | FY2023 | FY2024 | FY2025 |
|---|---|---|---|---|---|
| Gross Profit Margin (%) | 17.9% | 15.7% | 14.7% | 20.1% | 21.7% |
| Operating Profit Margin (%) | 7.9% | 5.6% | 4.3% | 9.1% | 10.2% |
| Net Profit Margin (%) | 4.7% | 3.0% | 1.8% | 5.8% | 7.1% |
| Return on Assets (%) | 7.5% | 4.6% | 2.8% | 9.3% | 10.7% |
| Return on Equity (%) | 16.3% | 10.9% | 6.7% | 19.4% | 21.4% |
Source: company filings [17] [18]. Click any linked figure to open the filing page with the row highlighted.
Leverage Liquidity (as reported)
| Leverage Liquidity (as reported) | FY2021 | FY2022 | FY2023 | FY2024 | FY2025 |
|---|---|---|---|---|---|
| Current Ratio (x) | 2.0 | 1.8 | 1.6 | 1.8 | 1.3 |
| Total Liabilities / Total Assets (x) | 0.5 | 0.6 | 0.6 | 0.5 | 0.5 |
| Total Liabilities / Total Equity (x) | 1.2 | 1.4 | 1.4 | 1.1 | 1.0 |
| Total Interest-Bearing Debt / Equity (x) | 0.8 | 0.9 | 0.9 | 0.6 | 0.6 |
Source: company filings [17] [18]. Click any linked figure to open the filing page with the row highlighted.
Long-Term Record
| Fiscal year | Total revenue (Net Sales) | Profit from operations | Profit attributable to owners | Basic EPS (Rp) | Operating cash flow |
|---|---|---|---|---|---|
| FY2016 | 27,063,310 | 3,171,745 | 2,064,650 | 189.00 | 2,753,605 |
| FY2017 | 29,602,688 | 2,275,098 | 997,352 | 88.00 | 770,662 |
| FY2018 | 34,012,965 | 3,843,879 | 2,167,961 | 187.00 | 1,840,529 |
| FY2019 | 36,742,561 | 3,149,918 | 1,765,178 | 151.00 | 1,879,537 |
| FY2020 | 36,964,948 | 2,484,207 | 916,711 | 79.00 | 4,099,440 |
| FY2021 | 44,878,300 | 3,524,974 | 2,022,596 | 174.00 | 701,246 |
| FY2022 | 48,972,085 | 2,750,349 | 1,419,855 | 122.00 | 1,426,749 |
| FY2023 | 51,175,898 | 2,206,405 | 929,716 | 80.00 | 2,371,932 |
| FY2024 | 55,800,849 | 5,061,875 | 3,018,892 | 260.00 | 4,860,422 |
| FY2025 | 60,715,806 | 6,183,584 | 4,003,999 | 344.00 | 5,012,140 |
Source: consolidated statements across filings; older years from the standardized feed [14] [1] [2]. Click any linked figure to open the filing page with the row highlighted.
Analyst Consensus
Mean target
Median target
High target
Low target
Street ratings: 11 strong buy, 2 buy. Consensus: Strong Buy.
Estimate source: S&P Capital IQ (CapIQ) consensus, as of 2026-08-03. Estimate figures are S&P Capital IQ consensus (vendor data — no filing page links). EPS and net income use the normalized (adjusted) consensus where the street reports it. Consensus revenue sits well below the as-reported line for the last actual year — analysts often model a narrower revenue basis (e.g. net of interest or pass-through costs), so compare trends, not levels. Line-item analyst models (segments, drivers, KPIs) are in the Visible Alpha tab.
Traceability
315 of 360 figures on this page (88%) link to the filing page where they are printed — click a linked figure to open the source PDF at that page with the row highlighted. Unlinked figures come from standardized data feeds or pre-filing years.
All figures are in millions of Rupiah, as printed in the audited consolidated financial statements ('Disajikan dalam jutaan Rupiah'). Basic EPS is in full Rupiah per share.
FY2021–FY2025 core statements are cited to each year's own audited annual report (its primary column). The bilingual (Indonesian/English) statements are the source; citation quotes use the printed Indonesian row label plus the figure.
FY2016–FY2020 long-term figures are from the standardized data feed (data/financials, sourced from JPFA's audited December-31 filings) and are shown without page links.
The numeric feed's 'net_income' equals profit attributable to owners of the parent (e.g. FY2025 Rp4,003,999 million), not total profit for the year (FY2025 Rp4,281,329 million, incl. non-controlling interests). The income statement shows both lines.
Revenue breakdown uses external sales by segment; external sales plus related-party sales equal consolidated net sales (e.g. FY2025: 60,268,587 external + 447,219 related = 60,715,806).
Company also reports segment results (profit) in the same note; only external revenue is surfaced here as the revenue-breakdown hero.
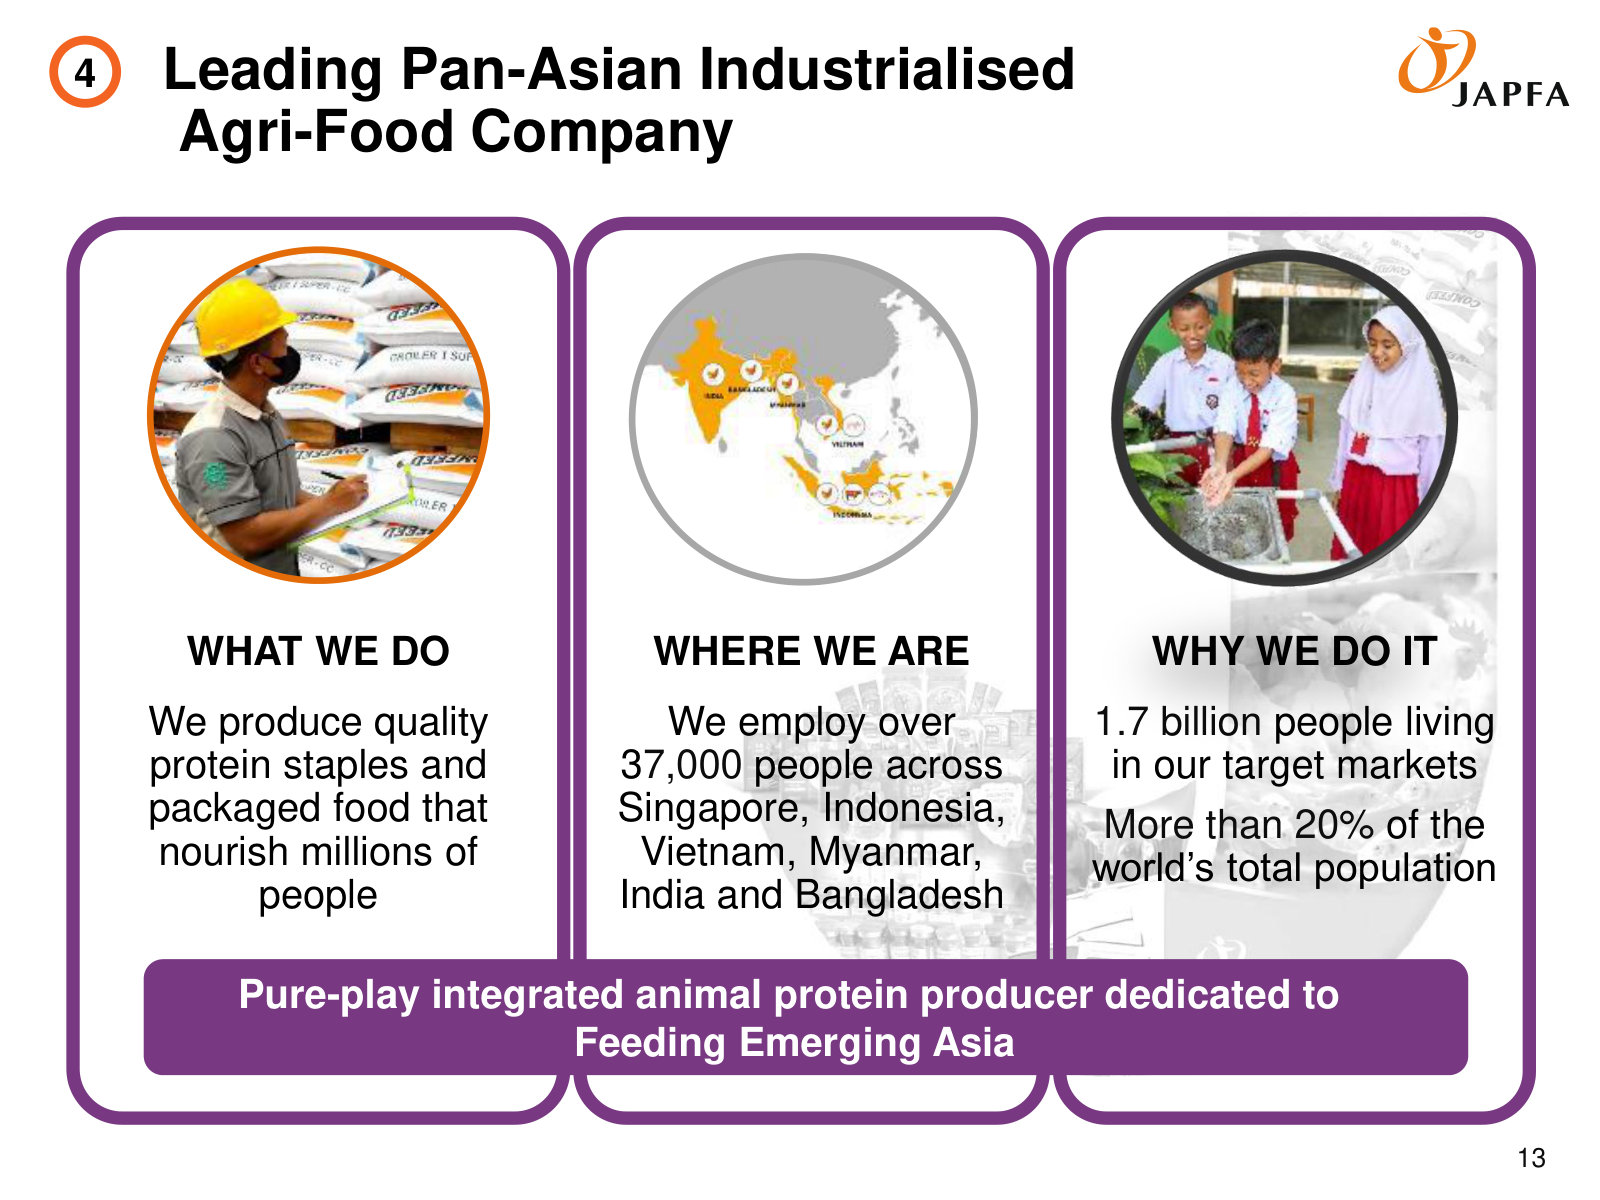
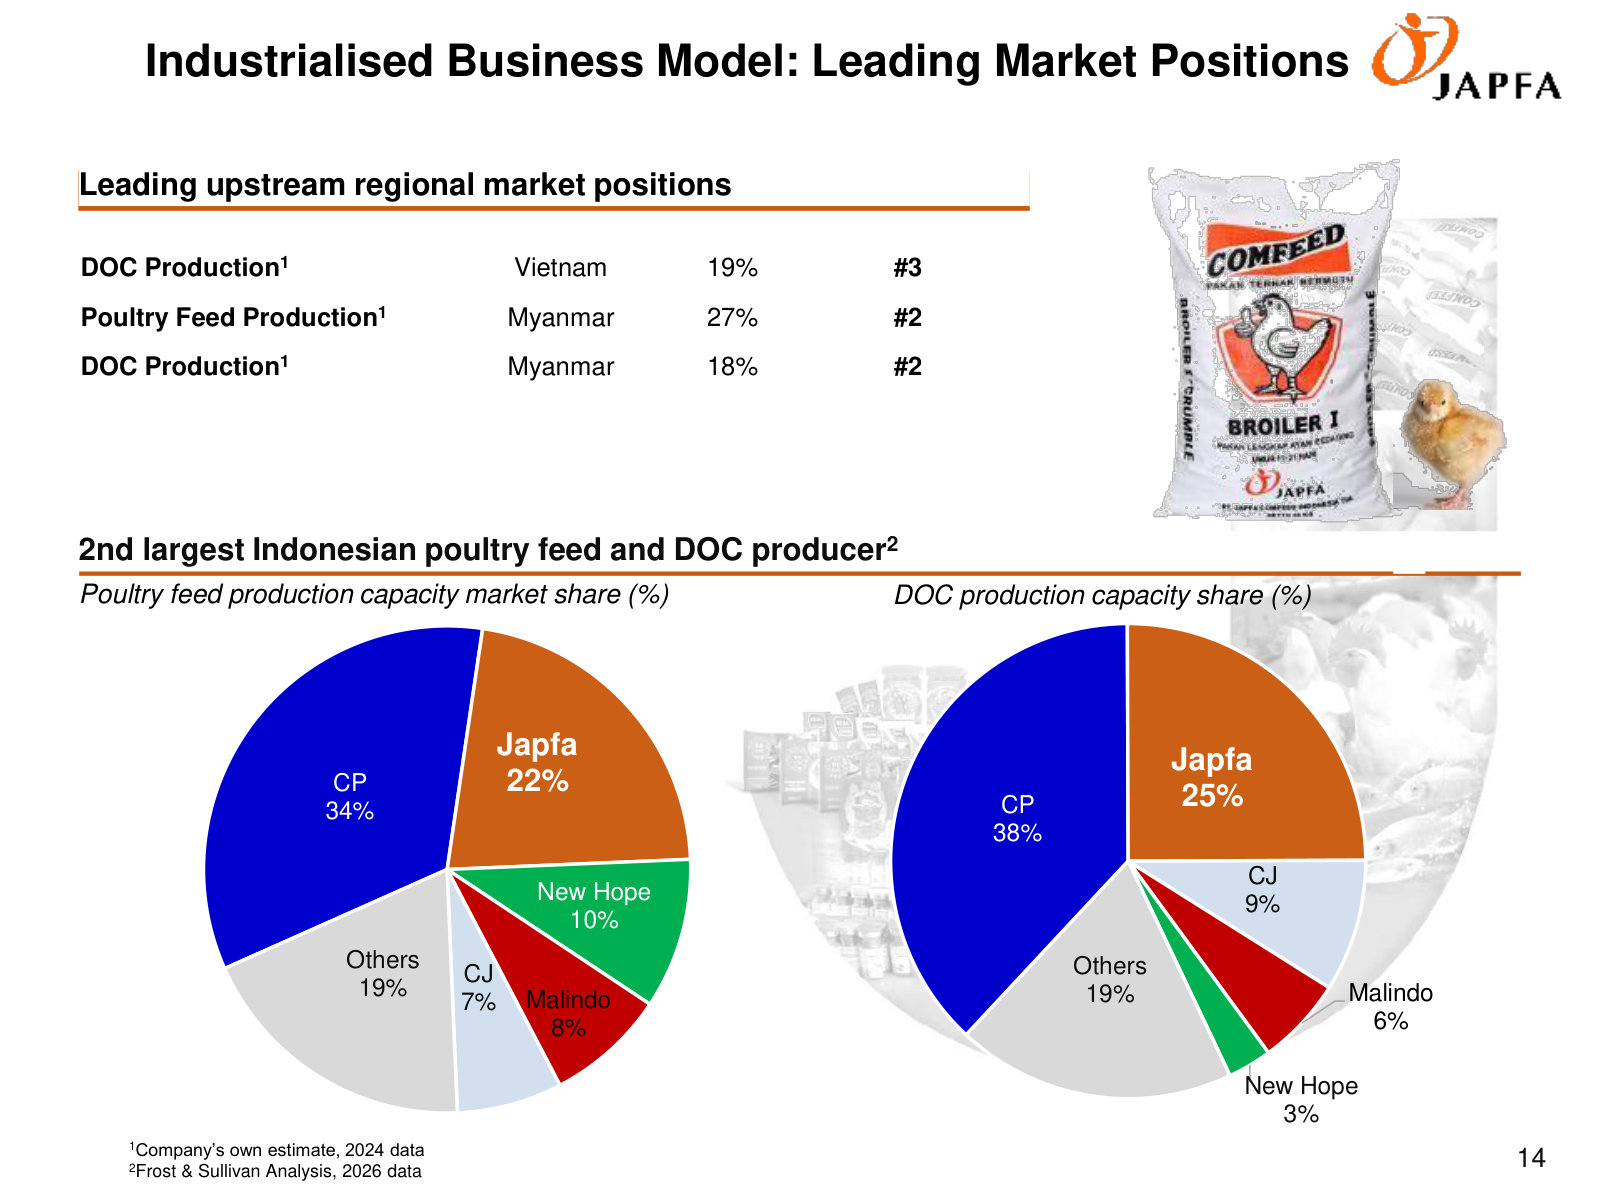
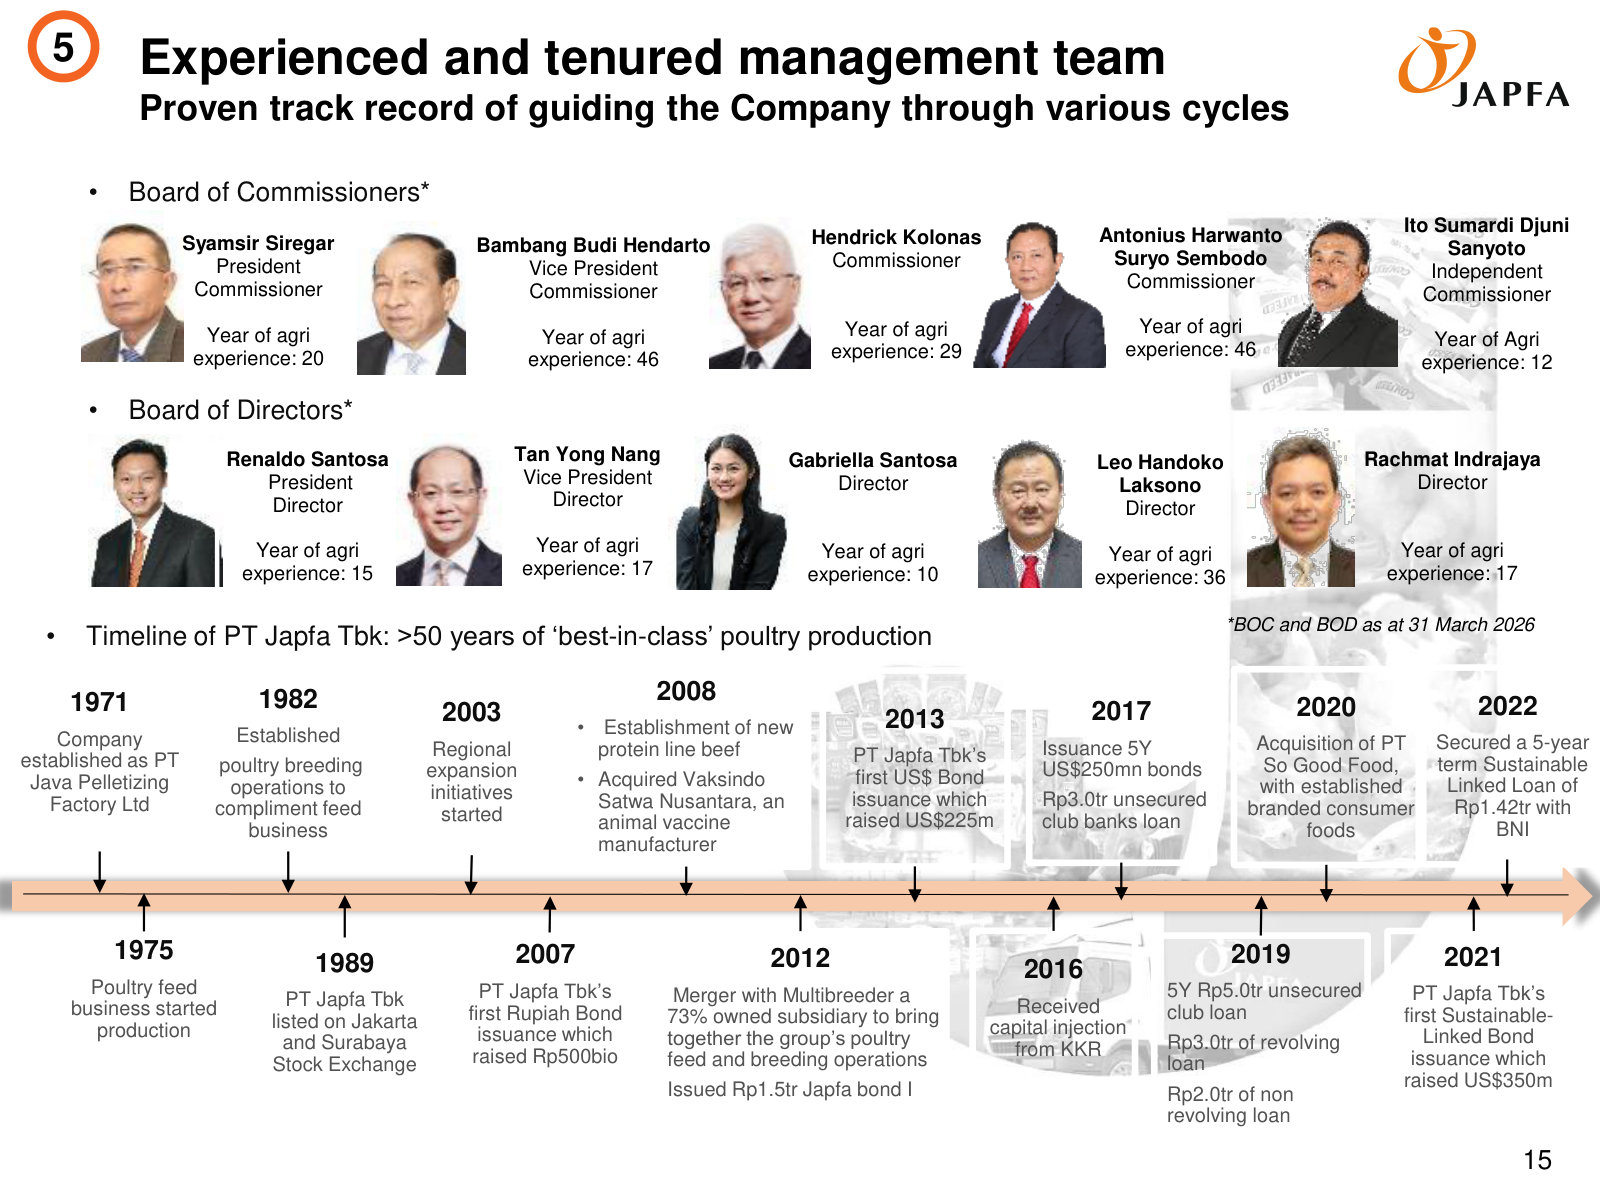
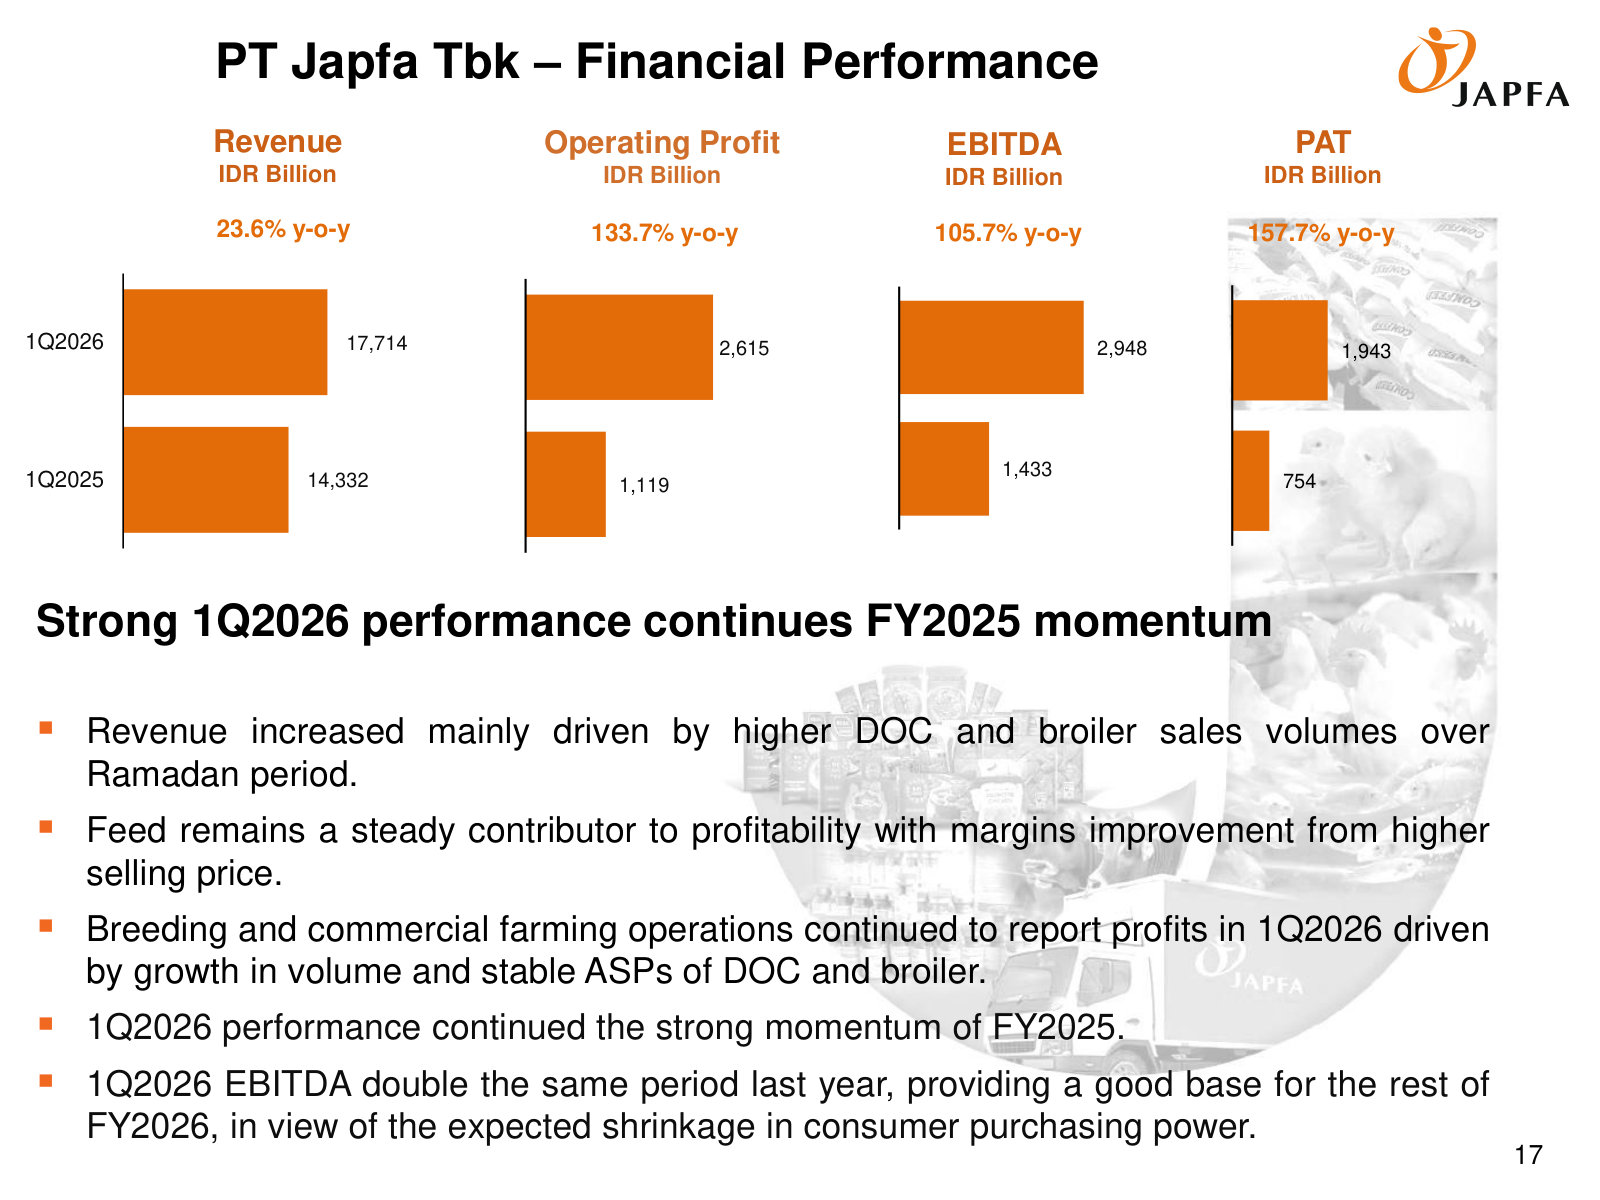
PT Japfa Comfeed Indonesia Tbk's management explains the business in its own materials. The slides below do the most of that work, pulled from the documents preserved in Sources. Each source link opens the complete presentation at that slide in a new tab.
Investor Presentation 1Q2026 — 1Q2026
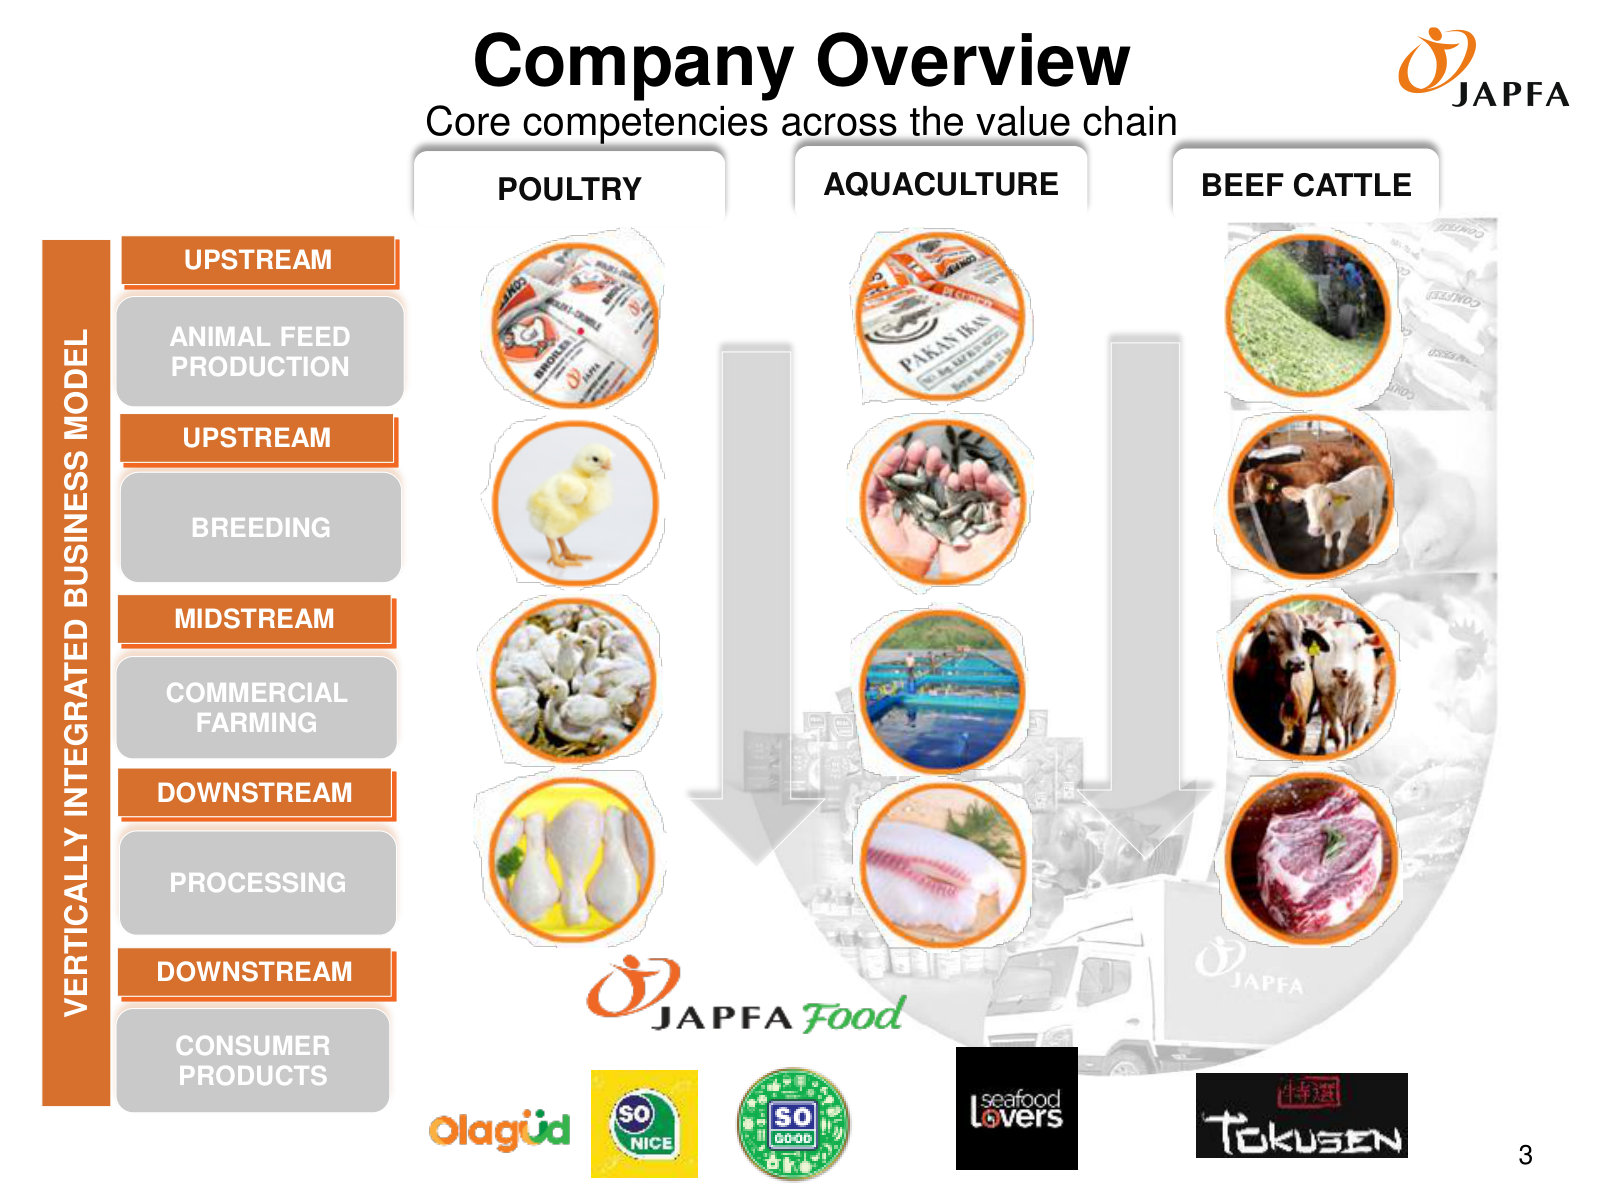
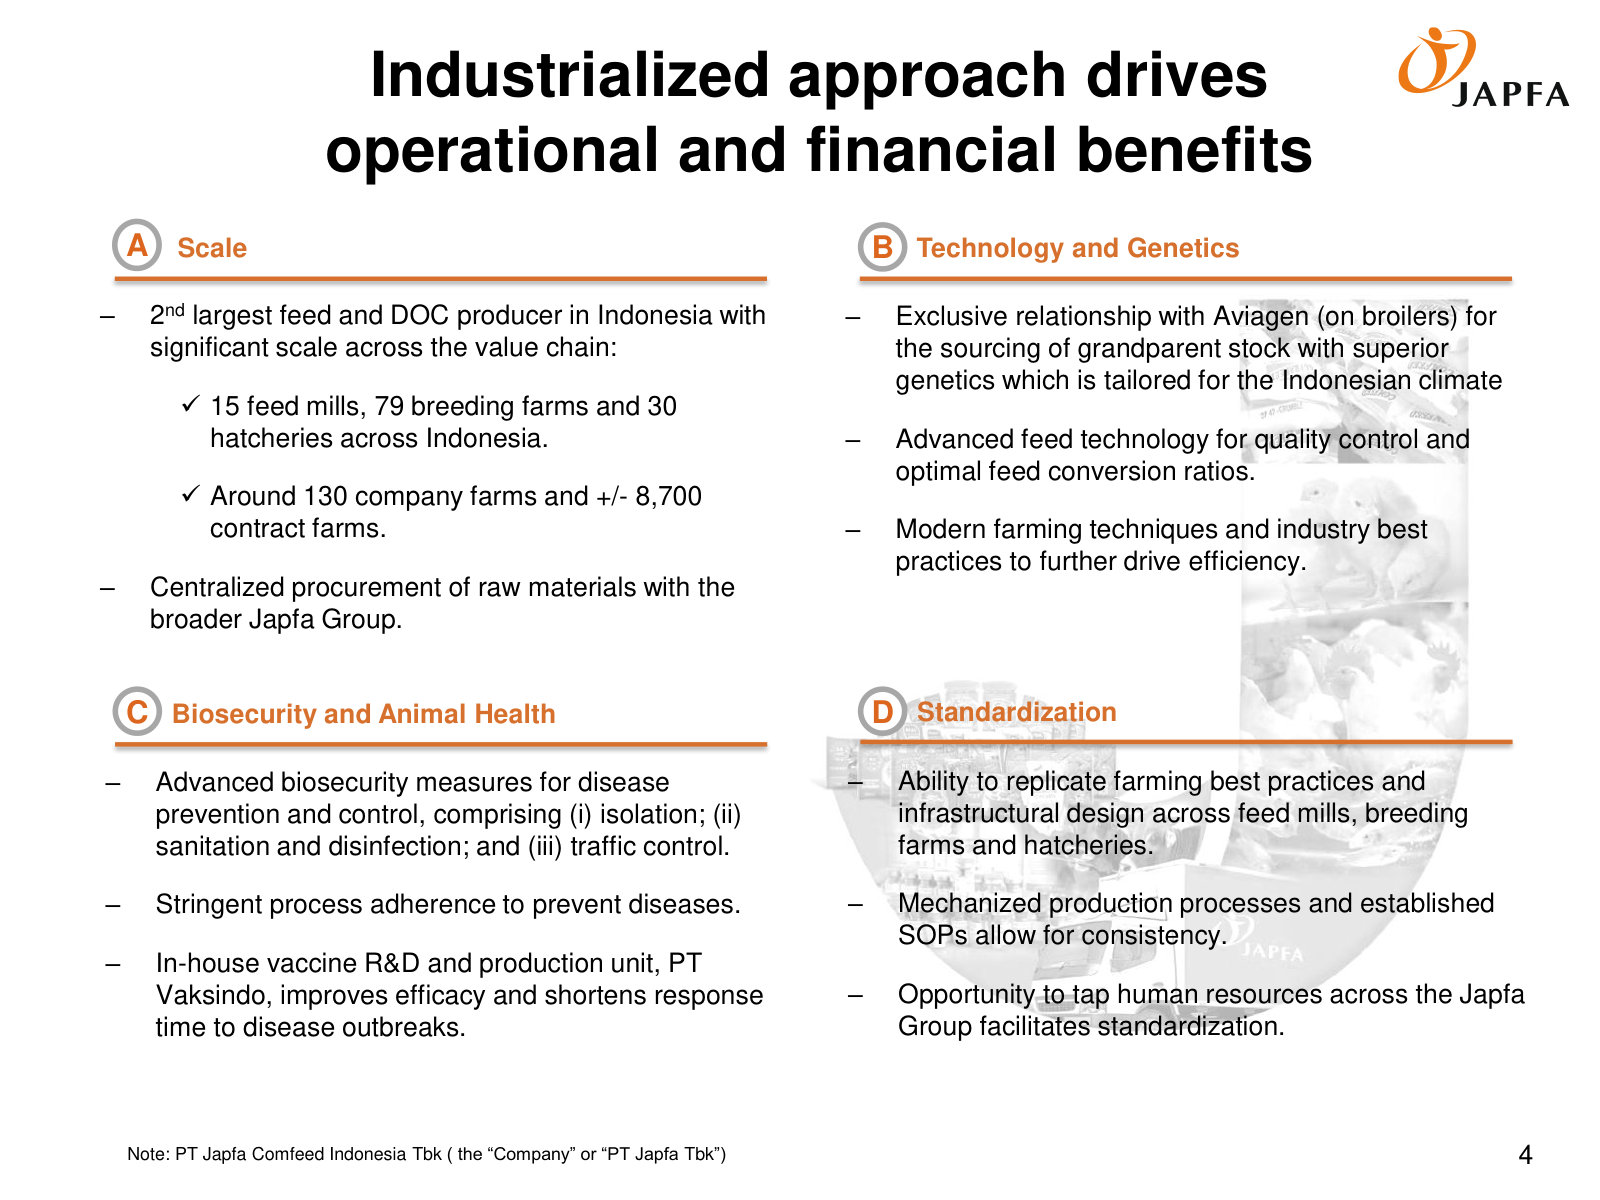
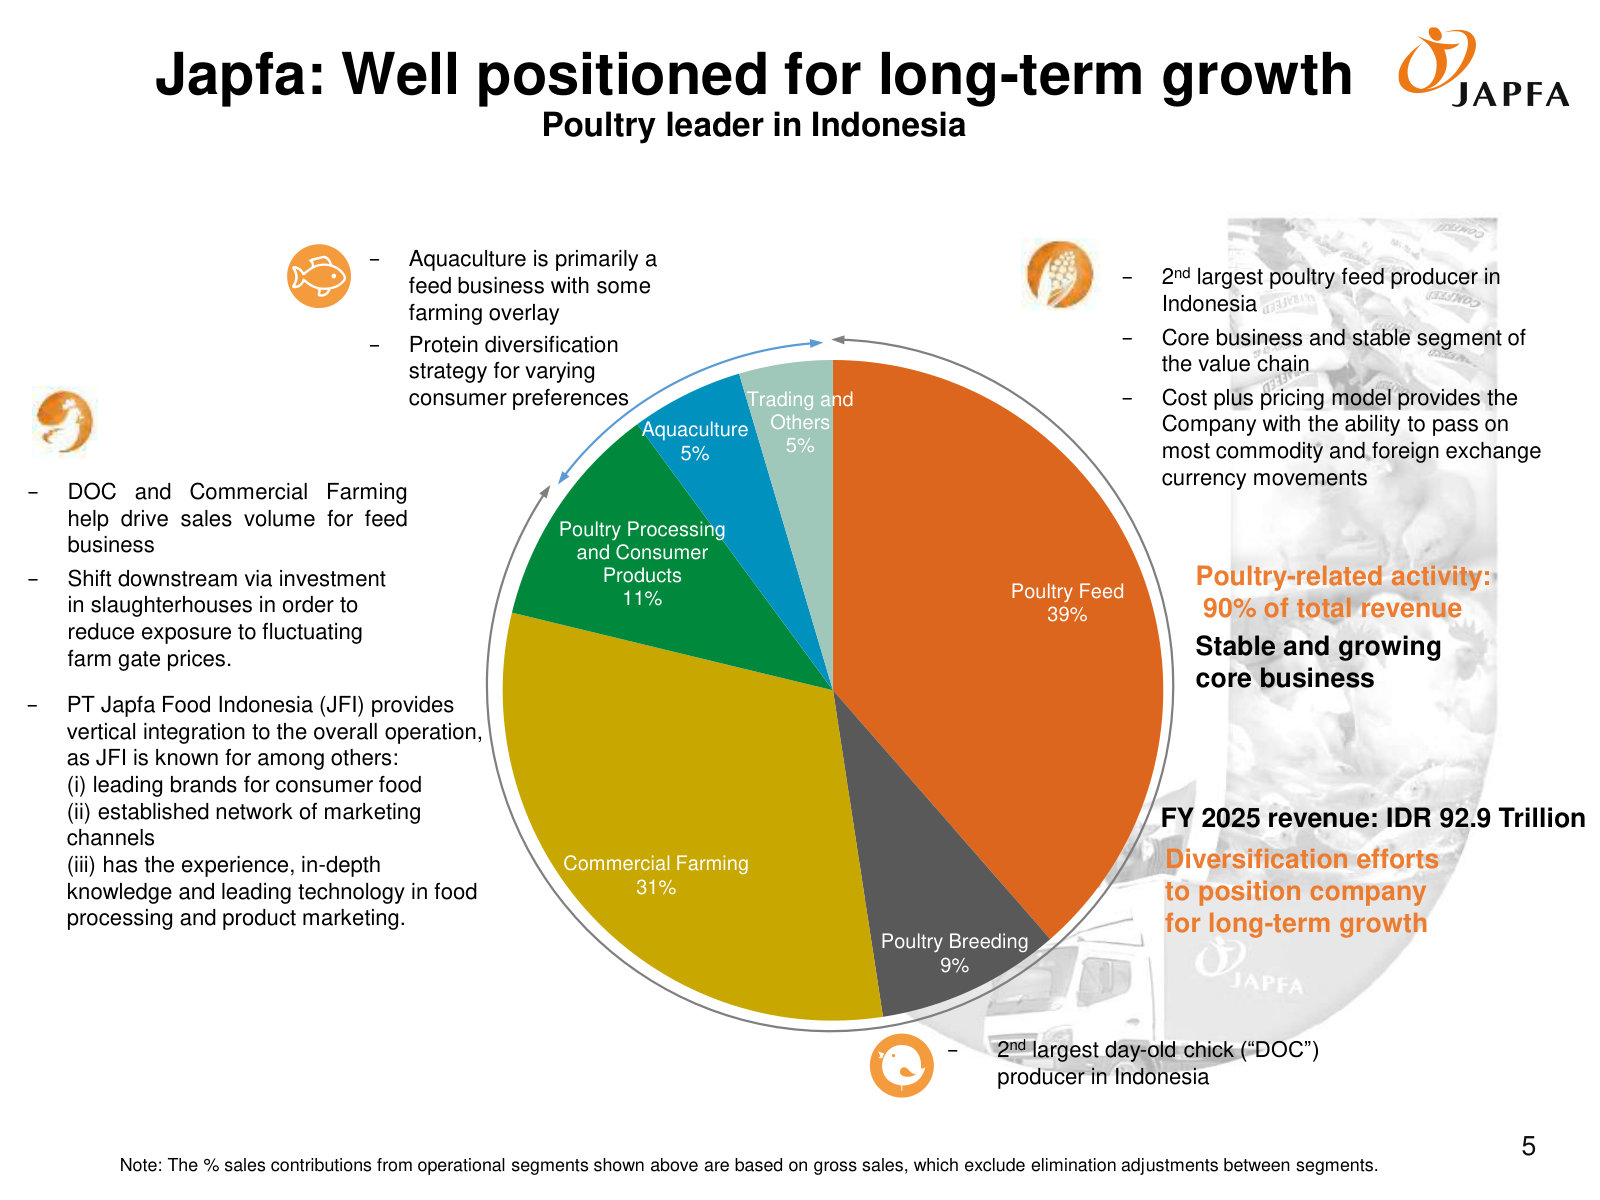
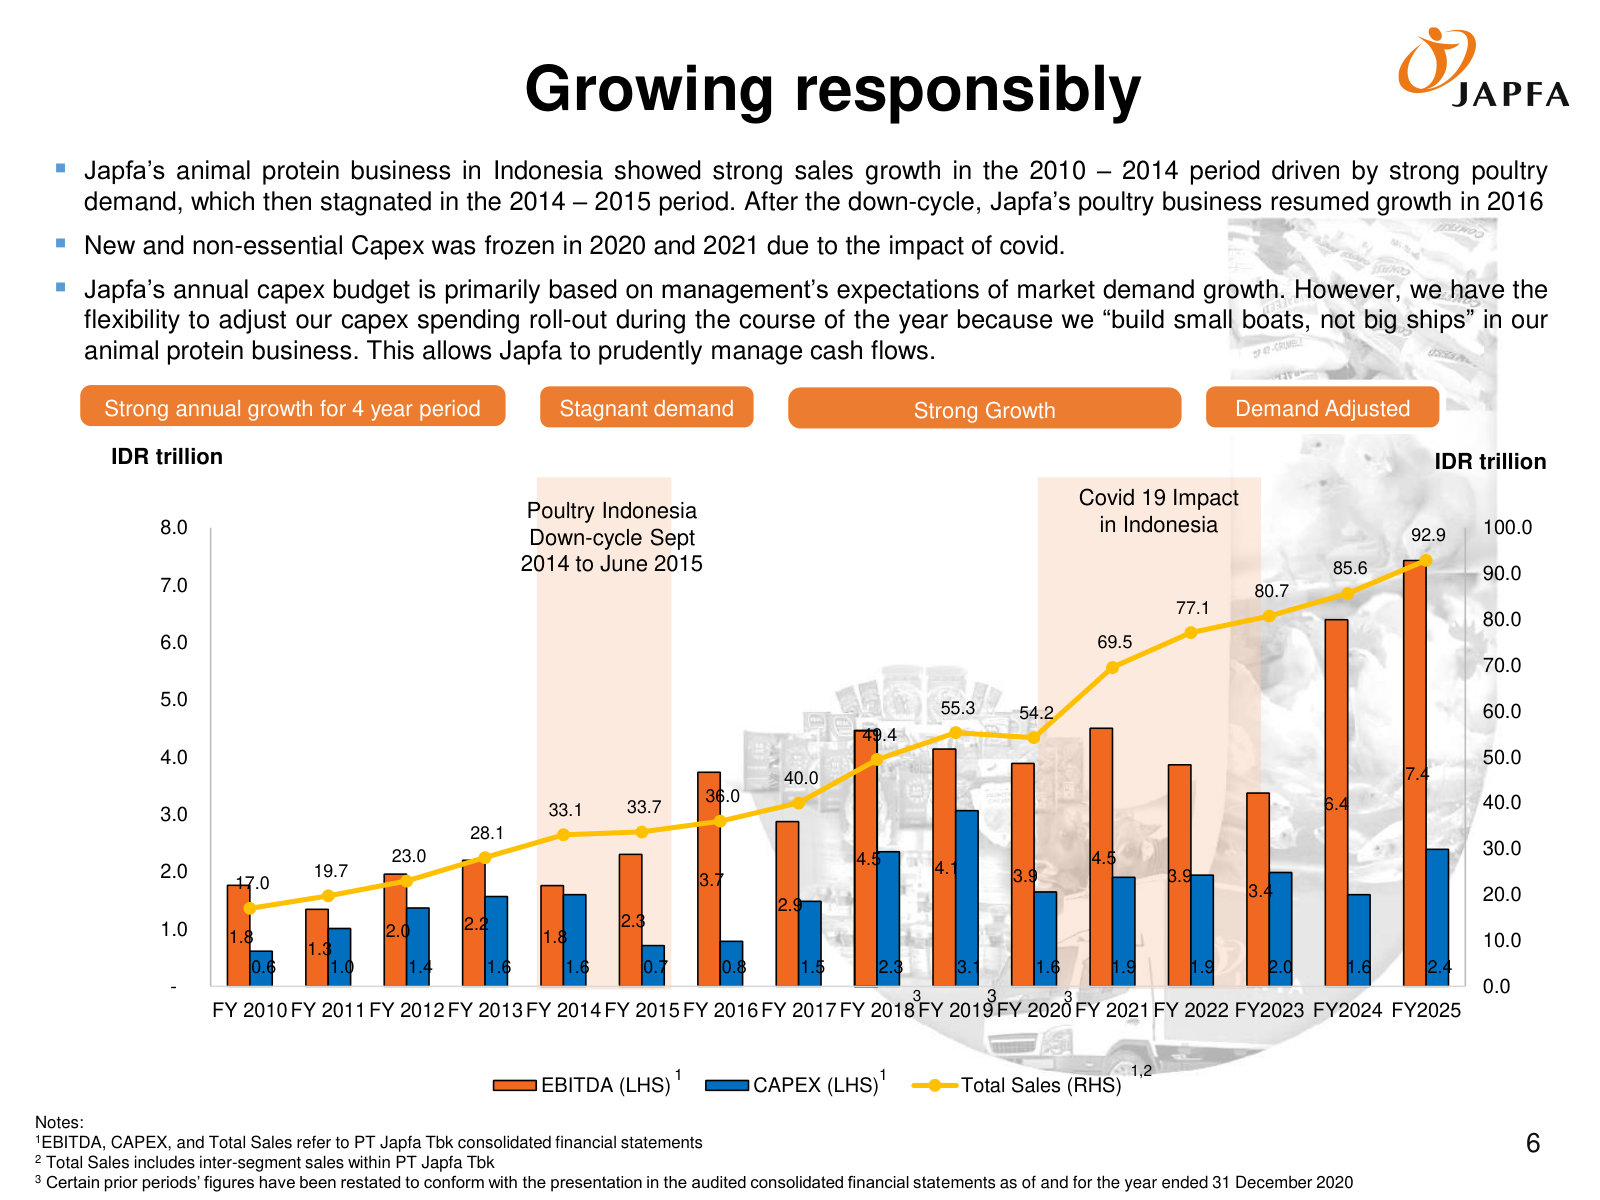
Management's current overview: what Japfa does across the poultry value chain, how segments earn, market position and latest financials. · Open the full document →
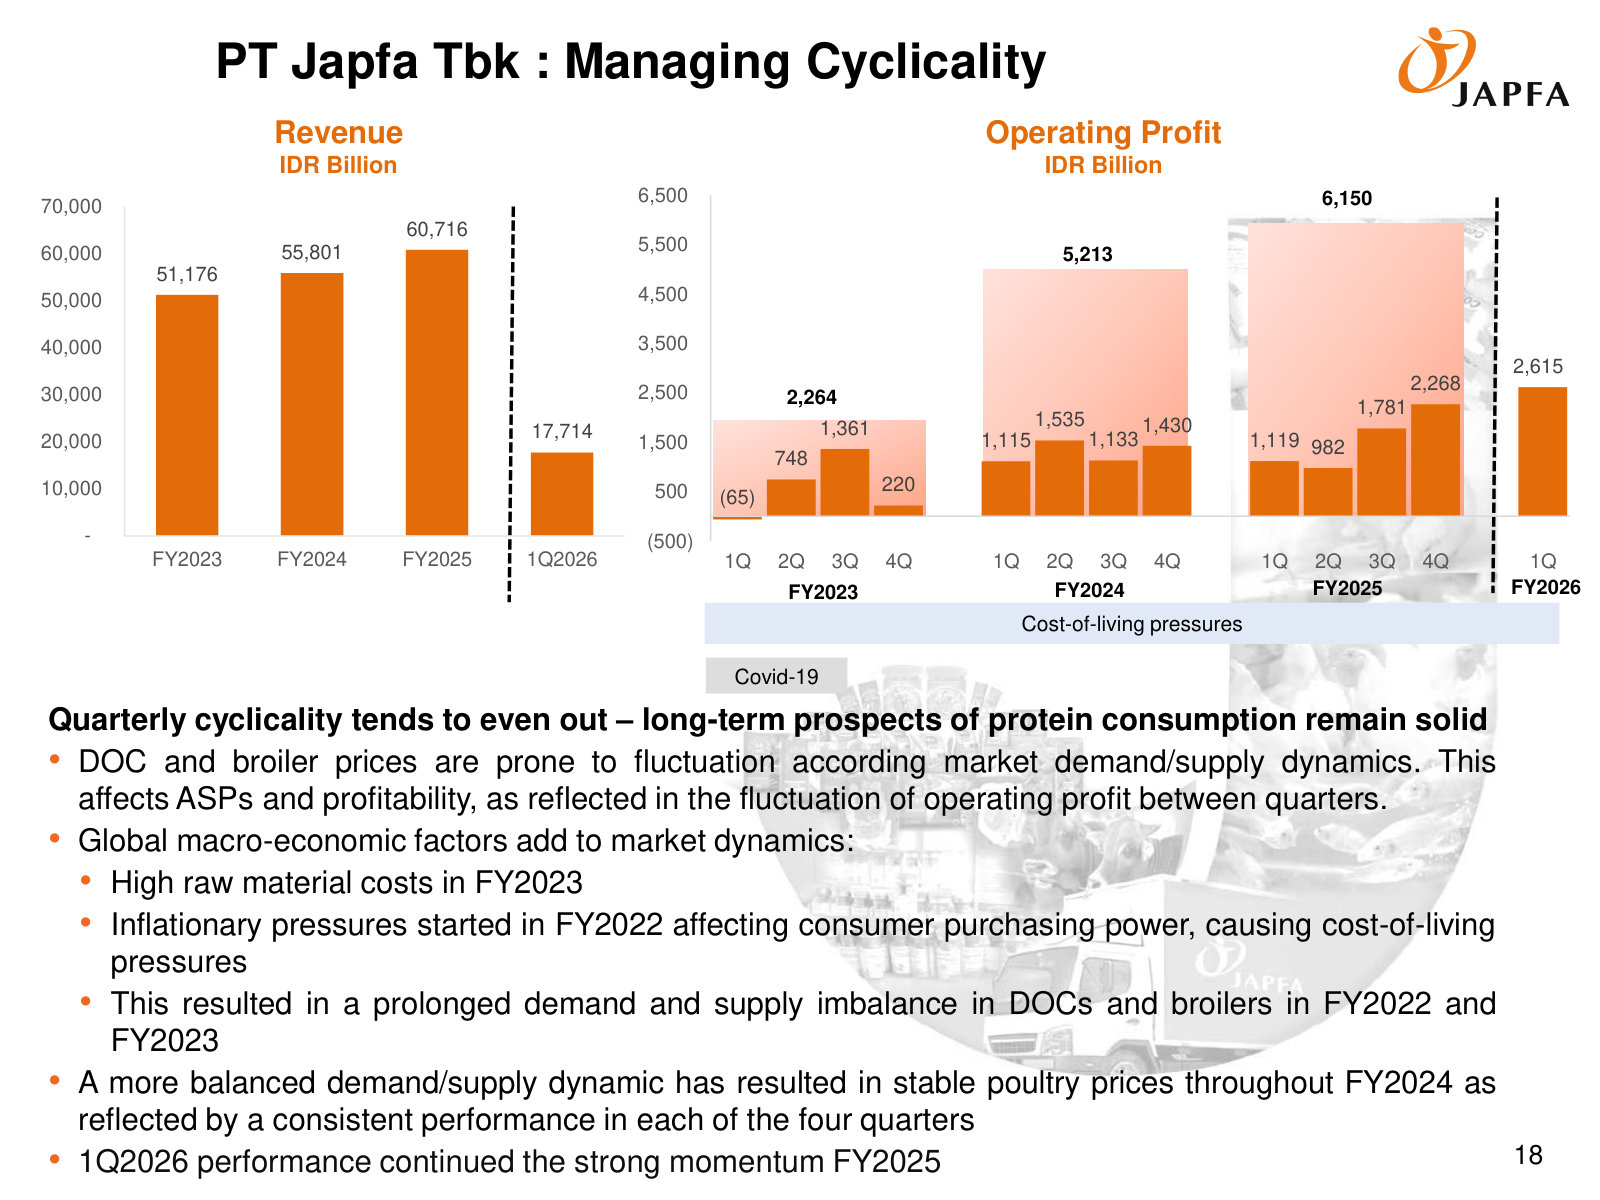
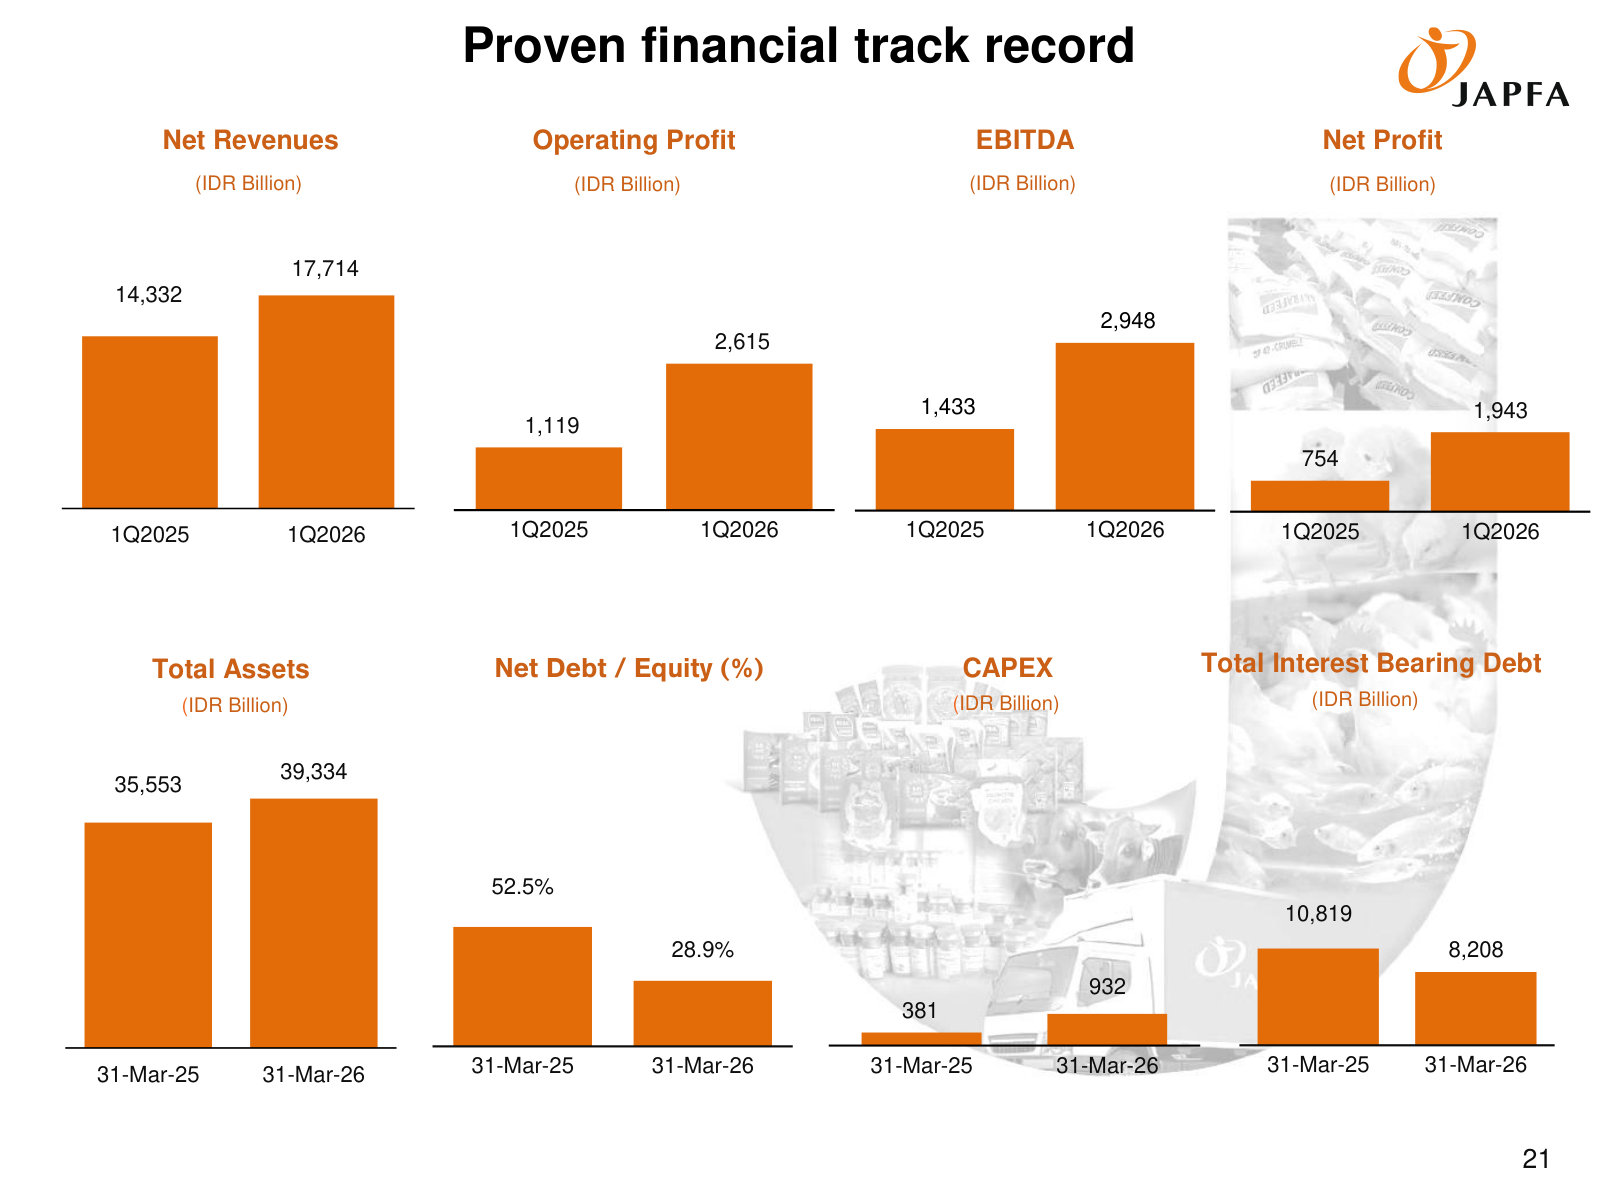
More from management
Investor Presentation FY2025 — FY2025 · 23 pages · The full-year FY2025 results — record EBITDA — in the same template, for annual segment and financial detail behind the 1Q2026 update. · Open →
Investor Presentation FY2024 — FY2024 · 24 pages · The exceptional FY2024 baseline year that management now benchmarks recent performance against. · Open →
Investor Presentation FY2023 — FY2023 · 27 pages · The FY2023 down-cycle deck — inflation and weak chicken demand — showing how the business presents a trough year. · Open →
Investor Presentation 2Q 2016 — 2Q2016 · 26 pages · How the company framed itself in the KKR-investment era, a decade before the recent up-cycle. · Open →
PT Japfa Comfeed Indonesia Tbk's annual reports contain management's most considered account of the business. These are the sections, passages and visual pages worth opening in the originals preserved in Sources.
PT Japfa Comfeed Indonesia Tbk — FY2025 Annual Report — FY2025 (year ended 31 December 2025)
Management's fullest account of a record year: net sales Rp60.7tn and profit Rp4.3tn (+33%), across six integrated protein segments. · Open the full document →
The Company In Brief (Company Profile) — p. 37 · Read the full section →
From copra pellets in 1971 to Indonesia's #2 feed producer — vertically integrated through the 2020 So Good Food acquisition.
Keunggulan Kompetitif / Competitive Strengths — p. 46 · Read the full section →
Management's own framing of the moat: scale, vertical integration and biosecurity across the feed-to-consumer chain.
Second-largest feed and poultry share, vertically integrated from feed mills to online retail.
The Company’s competitive strengths include among others: […] Having an integrated business line, the Company is among the biggest agribusiness players in Indonesia in the segments of feed production, poultry breeding and commercial farming, aquaculture. Currently, the Company has the second biggest market share in Indonesia in the feed and poultry segments. The Company also has one of the largest market share in the aqua feed segment in Indonesia. […] The Company has developed vertically integrated operations that cover animal feed, breeding and hatcheries, commercial farming, poultry processing and consumer products. The Company’s vertical integration also covers supporting infrastructure, after-sales services, laboratory testing of feed, agriculture environment changes, vaccine research and other distribution facilities, such as poultry feed packaging production and transportation for DOC delivery, and ofline and online retail stores.
p. 46 · Read in context →
Laporan Direksi / Board of Directors Report — p. 26 · Read the full section →
The Directors explain how a challenging, low-purchasing-power year still produced record sales and a 33% profit jump.
FY2025 results: net sales +8.8% to Rp60.7tn, profit +33.3% to Rp4.3tn, equity +20.8%.
In 2025, the Company recorded net sales of Rp60.7 trillion, an increase of 8.8% from Rp55.8 trillion in the previous year. This growth was driven by nearly all business segments, led by the poultry processing and consumer products segment, followed by commercial farm and animal feed. The Company posted a profit for the year of Rp4.3 trillion, up 33.3% from Rp3.2 trillion last year.
From a fundamental standpoint, the Company reported asset growth of 15.6% to Rp40.1 trillion and an increase in equity of 20.8% to Rp20.0 trillion, while total liabilities rose 10.8% to Rp20.1 trillion.
p. 30 · Read in context →
Tinjauan Per Segmen Usaha / Business Segment Review — p. 93 · Read the full section →
How the revenue is actually earned — six segments, with feed and commercial farming supplying the bulk.
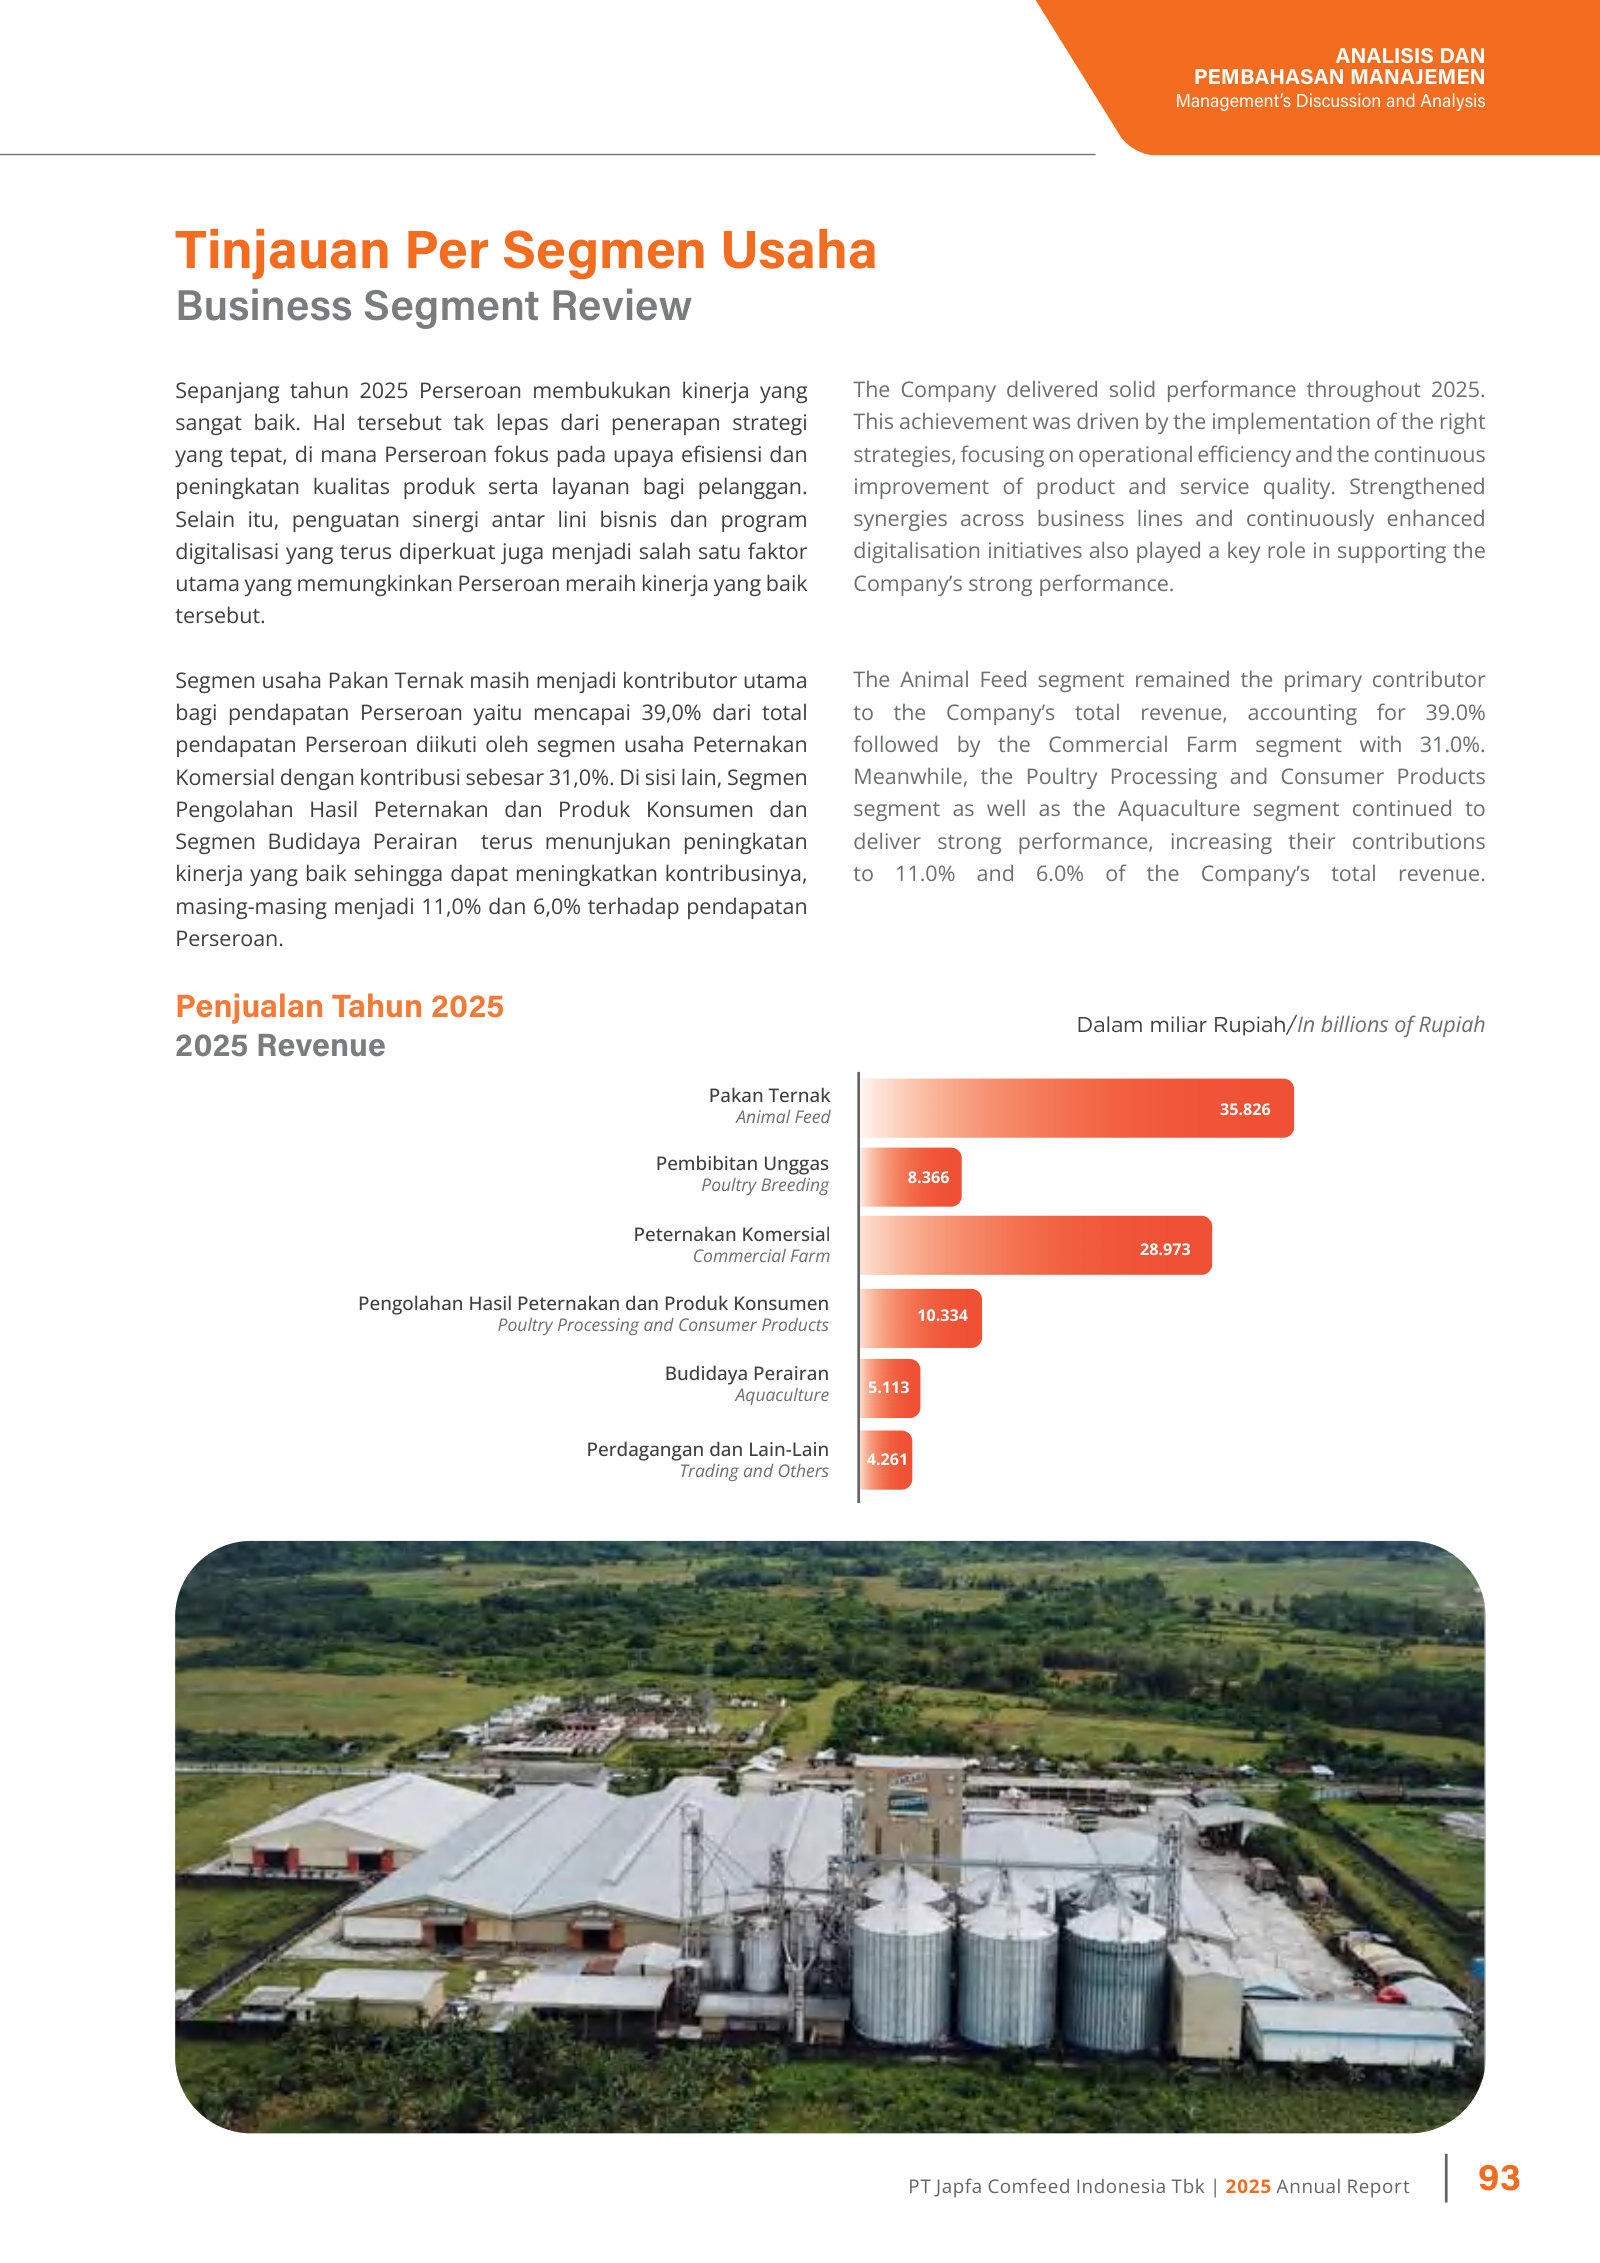
Feed 39% and Commercial Farm 31% of revenue; processing/consumer and aquaculture rising.
The Animal Feed segment remained the primary contributor to the Company’s total revenue, accounting for 39.0% followed by the Commercial Farm segment with 31.0%. Meanwhile, the Poultry Processing and Consumer Products segment as well as the Aquaculture segment continued to deliver strong performance, increasing their contributions to 11.0% and 6.0% of the Company’s total revenue.
p. 93 · Read in context →
Tinjauan Keuangan / Financial Review — p. 104 · Read the full section →
The audited P&L behind the headline: gross profit +17.6% and the biological-asset fair-value line that marks a livestock business.
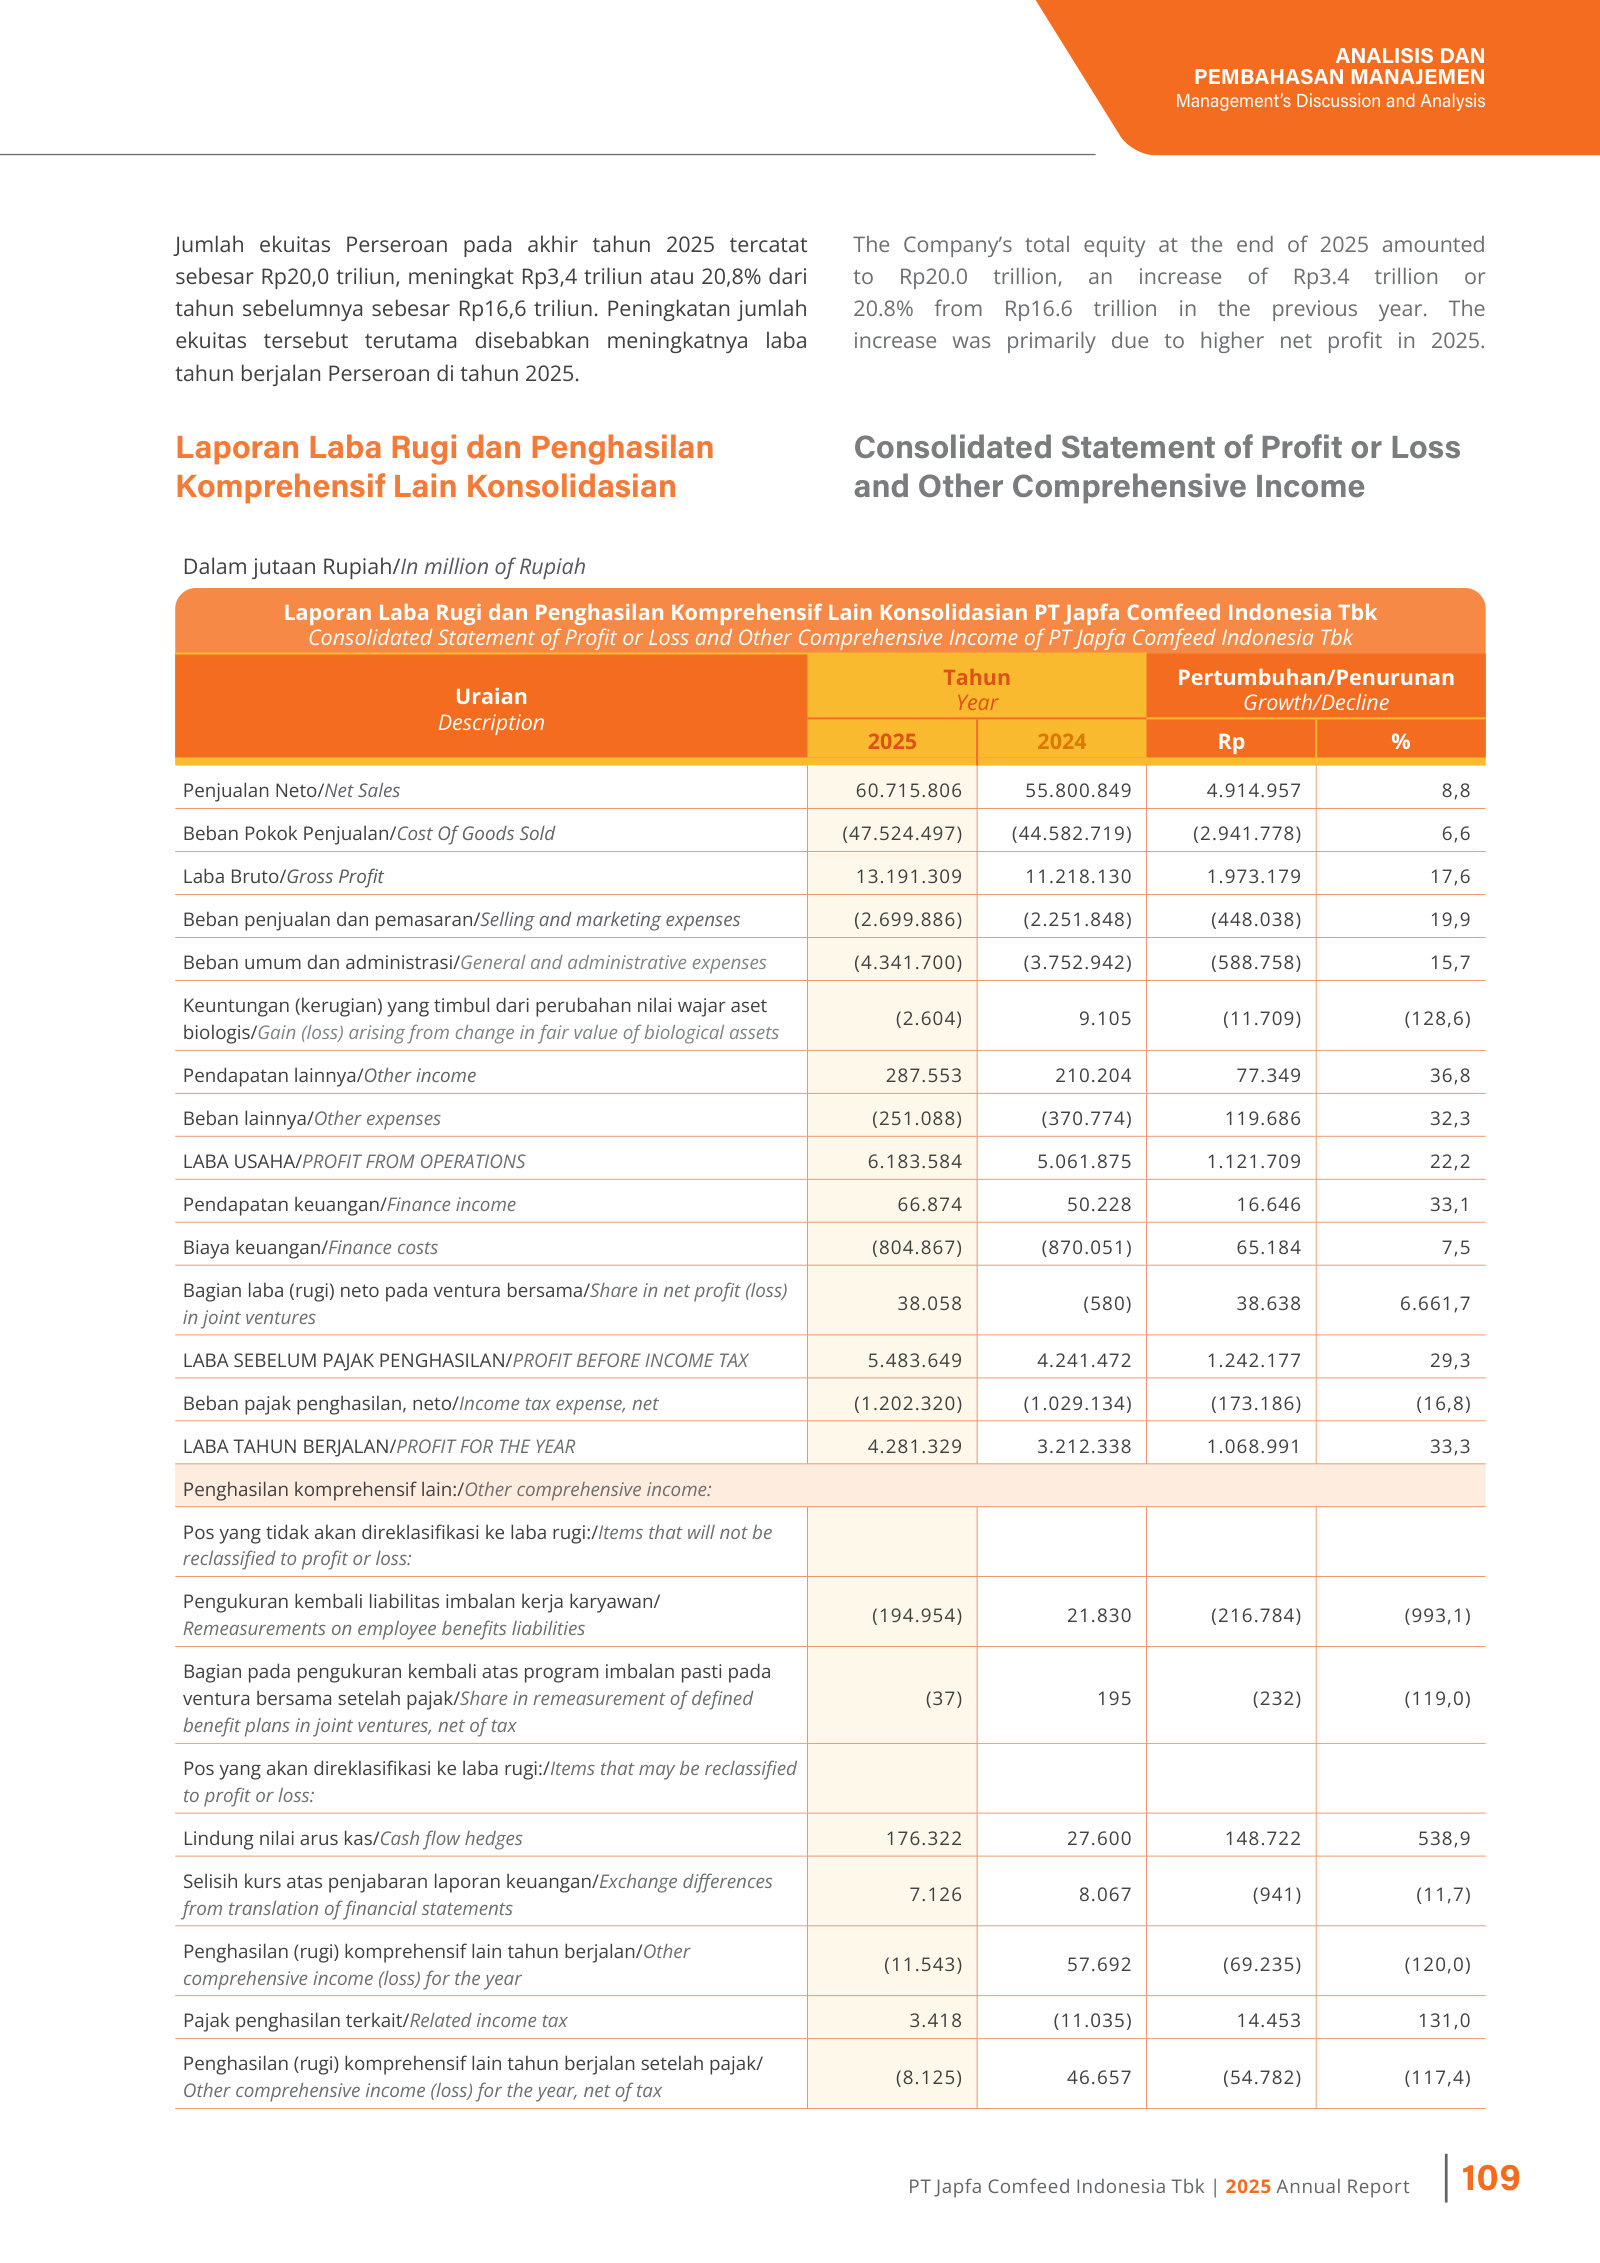
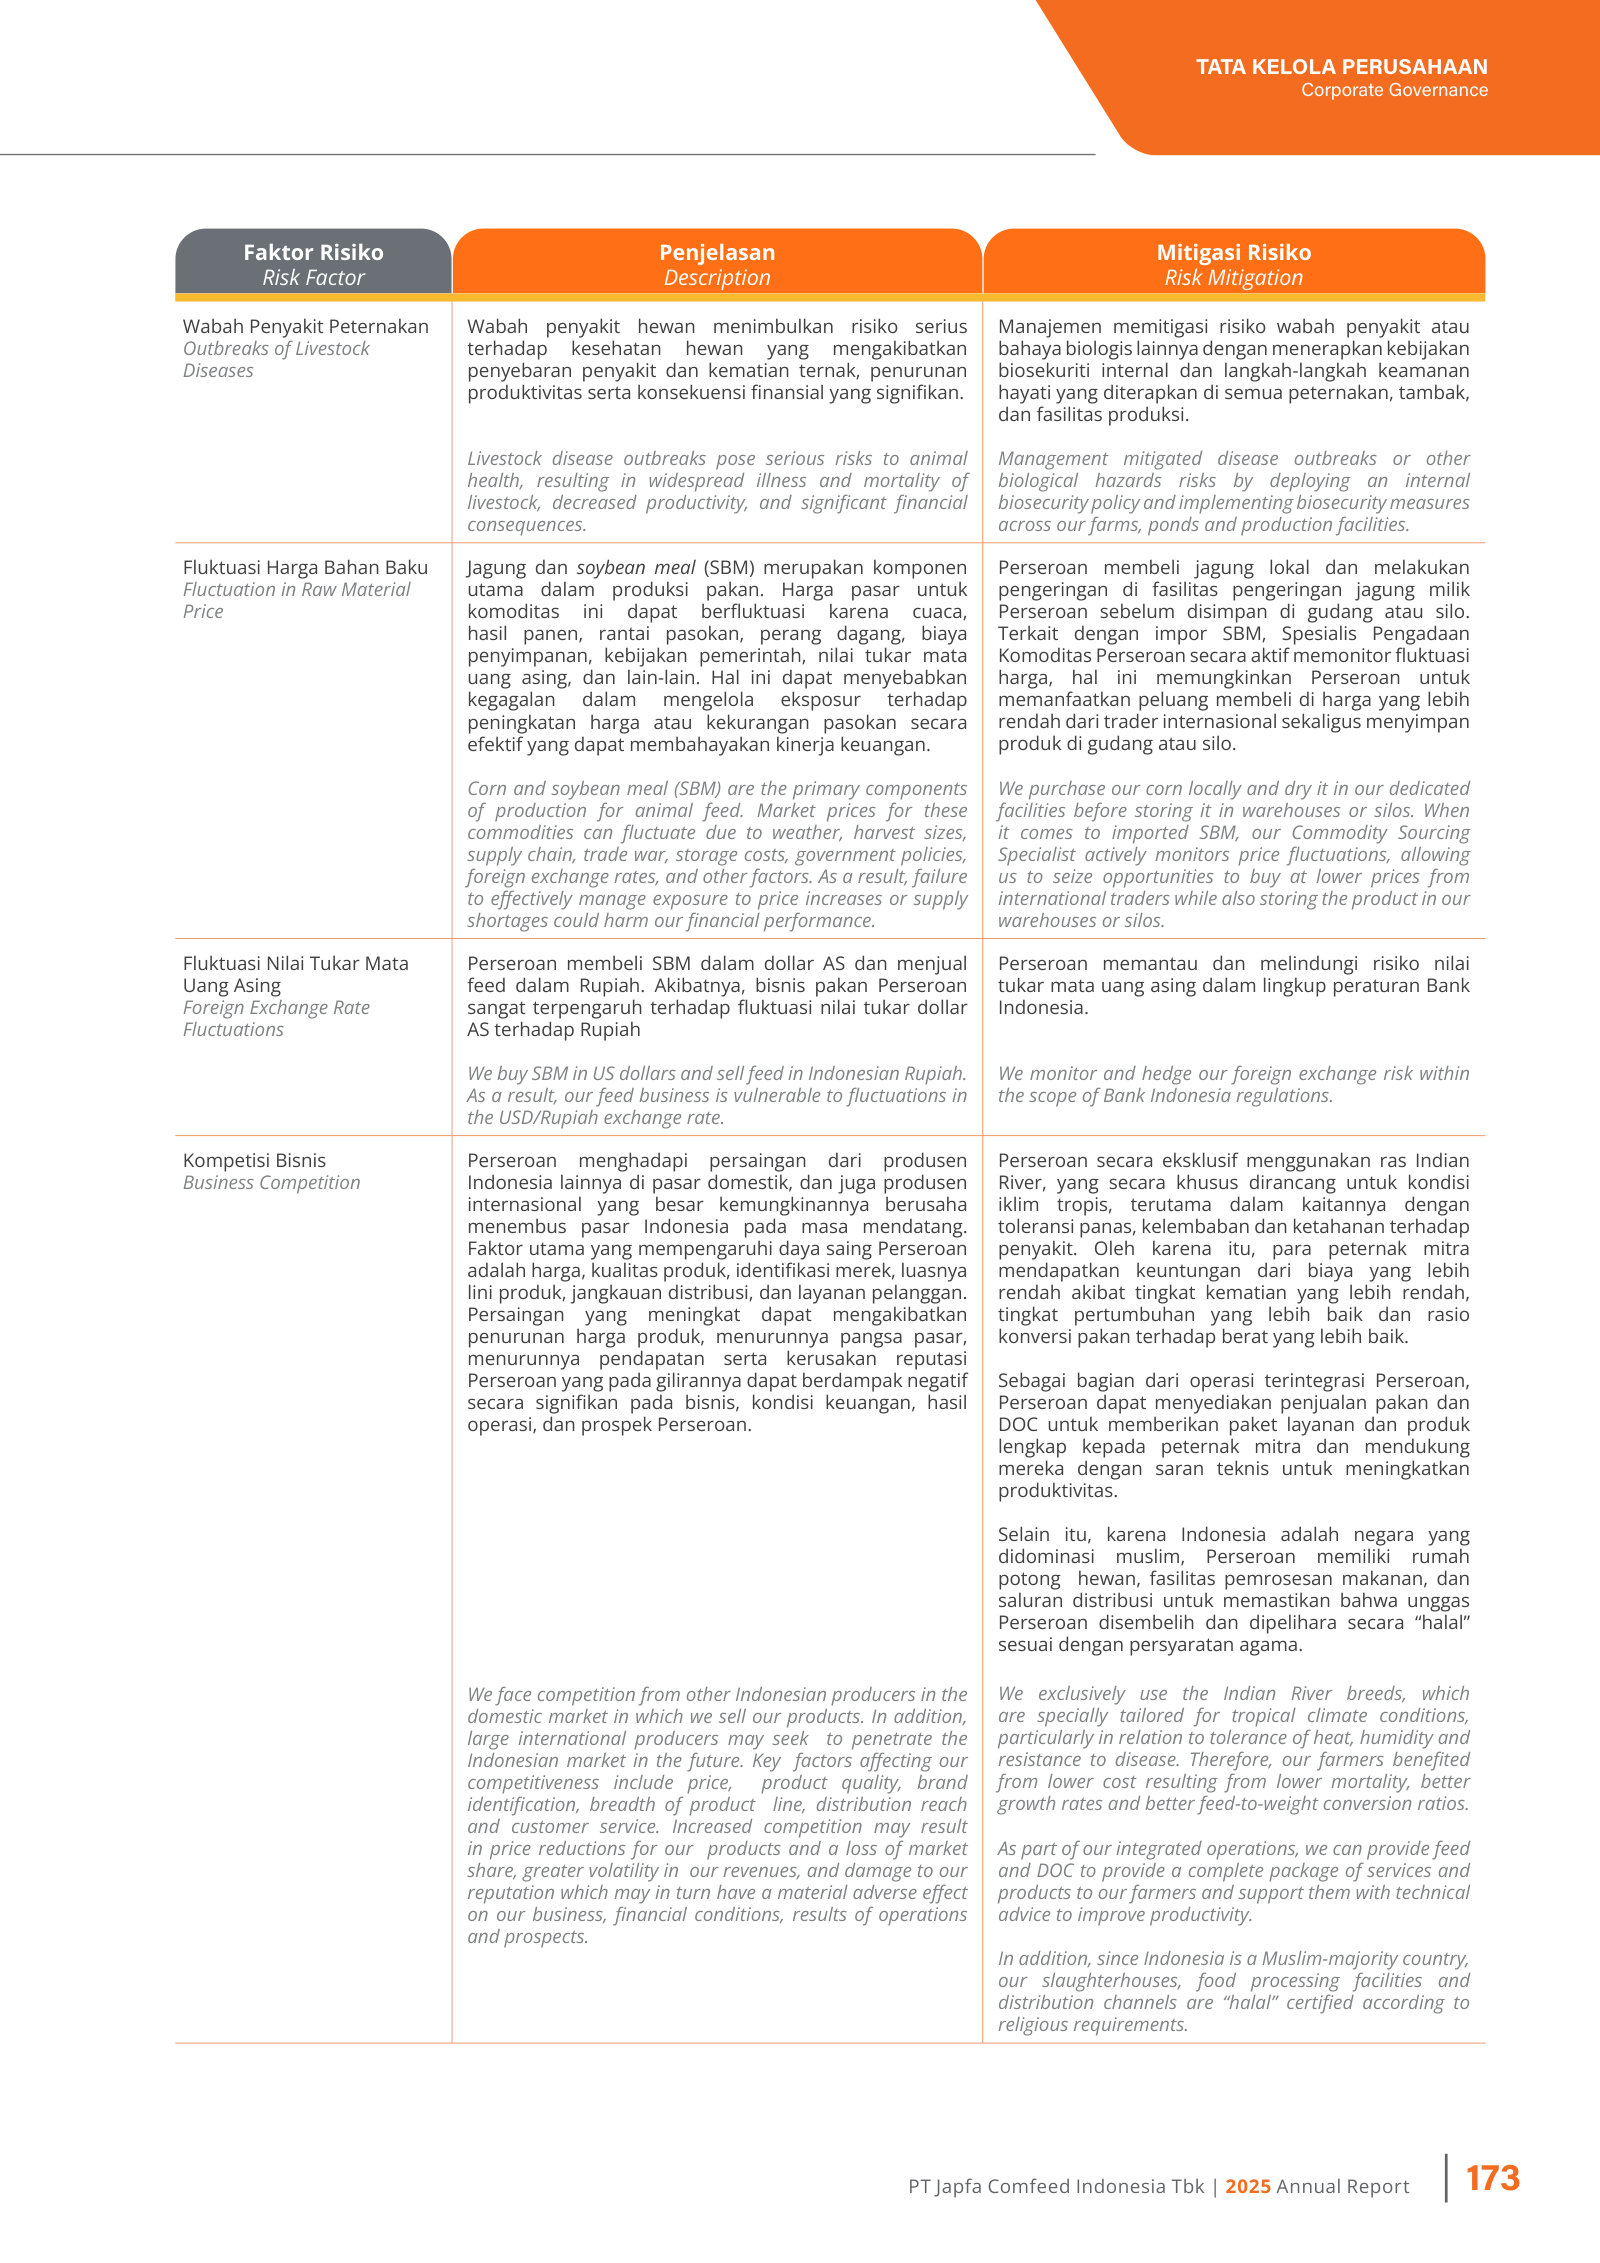
Manajemen Risiko / Risk Management — p. 172 · Read the full section →
Risks that can genuinely bite a feed-and-livestock producer: disease outbreaks, corn/SBM price swings, and USD inputs sold in Rupiah.
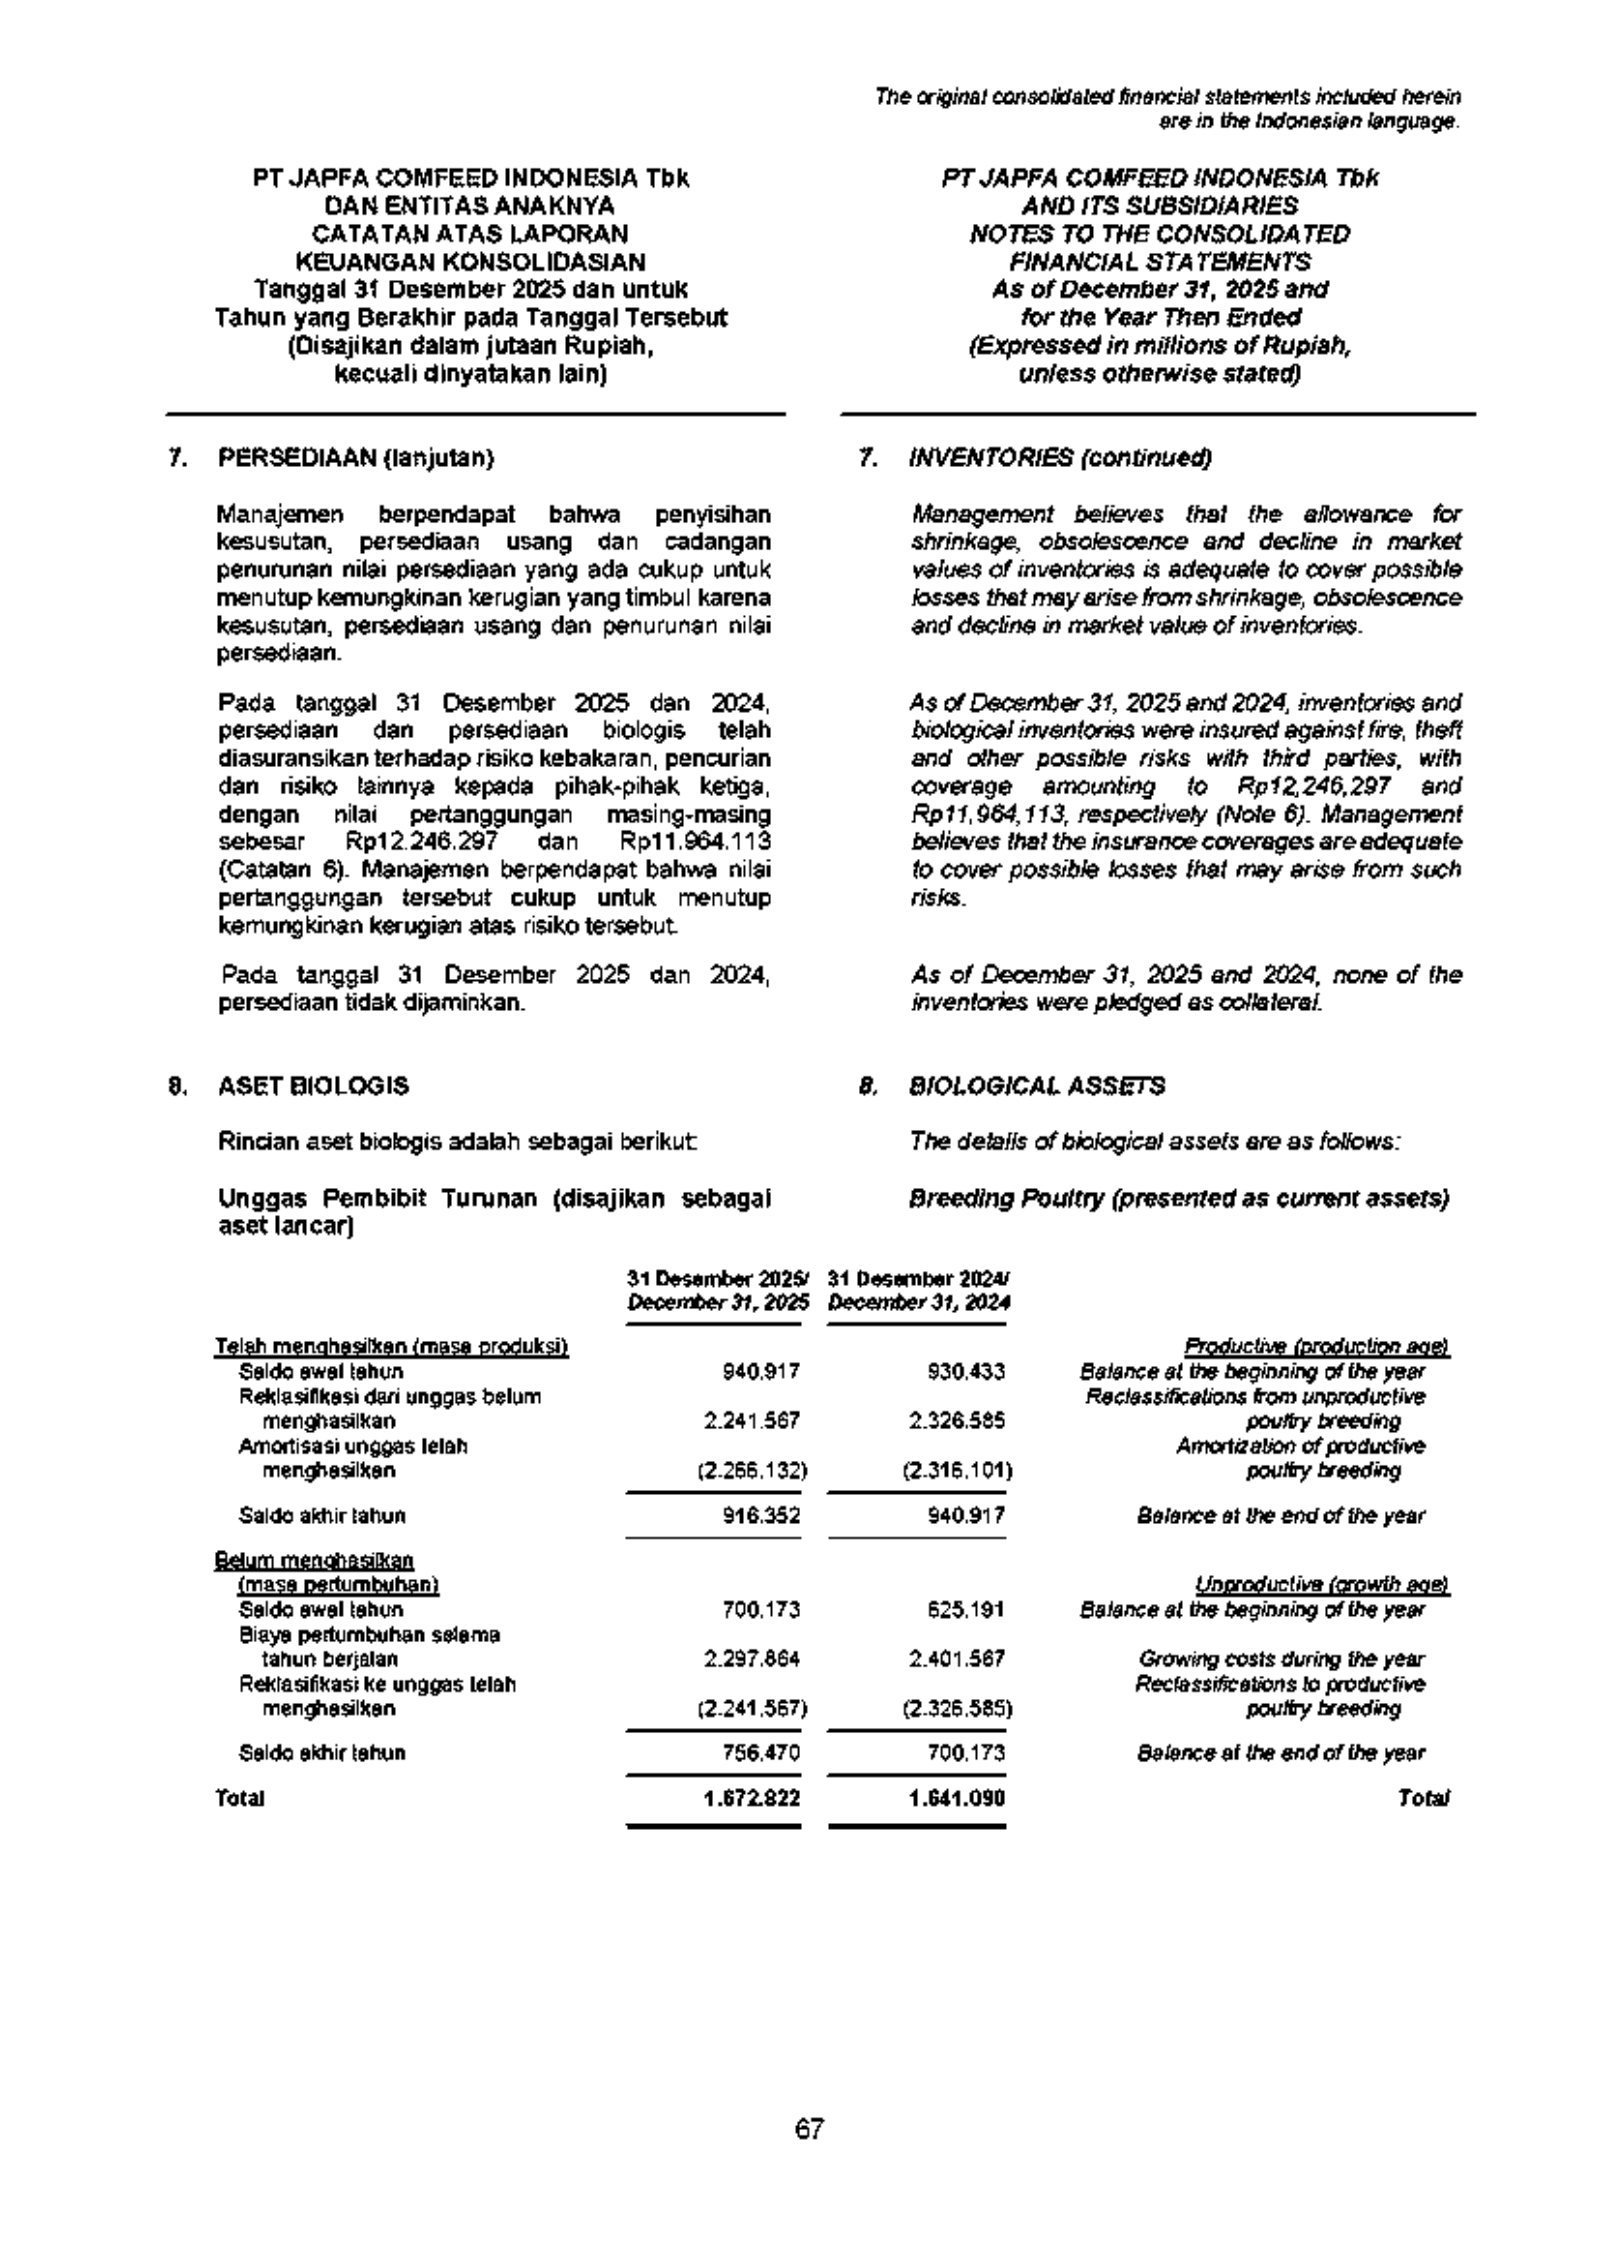
Aset Biologis / Biological Assets (Note 8) — p. 309 · Read the full section →
The accounting policy that defines a livestock model — breeding poultry and cattle carried at fair value less costs to sell.
More annual reports
PT Japfa Comfeed Indonesia Tbk — FY2024 Annual Report — FY2024 · 389 pages · Prior year (net sales Rp55.8tn, profit Rp3.2tn) — the base the FY2025 record was measured against. · Open →
PT Japfa Comfeed Indonesia Tbk — FY2023 Annual Report — FY2023 · 415 pages · A weaker-margin year, useful for seeing the poultry-cycle trough before the FY2024–25 recovery. · Open →
PT Japfa Comfeed Indonesia Tbk — FY2022 Annual Report — FY2022 · 400 pages · Post-pandemic normalisation year for the integrated protein segments. · Open →
PT Japfa Comfeed Indonesia Tbk — FY2021 Annual Report — FY2021 · 388 pages · First full year after the So Good Food consolidation reshaped the consumer-products segment. · Open →
Competitors describe PT Japfa Comfeed Indonesia Tbk's market in their own filings and calls. These verified passages and visual pages show where their strategies meet, using source documents preserved in Sources.
Charoen Pokphand Foods (CPF)
The closest pan-Asian analogue to Japfa — a vertically integrated feed–farm–food group spanning broiler, swine, shrimp and processed protein. Its annual report benchmarks the global protein markets Japfa sells into and, notably, ranks Japfa among the world's largest broiler producers — ahead of CPF itself.
CPF's stated sizing of the global broiler market Japfa also serves — record output and Thailand ranked the world's fourth-largest exporter. Context for the price and volume backdrop across the region.
In 2025, global broiler production reached 107.6 million tons, an increase from 2024 (104.2 million tons). […] Thailand ranked as the world’s fourth-largest broiler exporter, with an export volume of approximately 1.25 million tons, representing an increase of 6.8% compared to 2024.
p. 36 · Read in context →
PT Central Proteina Prima Tbk (CPRO)
Indonesia's entrenched aquaculture and aquafeed group (shrimp and fish feed, hatchery, processed seafood), and the most direct domestic rival to Japfa's Aquaculture segment. Its filing frames its own market position and the shrimp-industry dynamics both companies face.
CPRO's stated market position in the segment it shares with Japfa's aqua business — self-described as a 'key player' in Indonesian aquaculture, still pursuing share gains through targeting, new customers and exports.
The Company is a key player in Indonesia’s aquaculture industry and remains committed to expanding its market share through more targeted marketing programs, the acquisition of new customers, and broader penetration into additional export markets.
p. 95 · Read in context →
CPRO's account of 2025 pressures on the Indonesian shrimp market both firms export into: an October 2025 Cesium-contamination scare that dented market sentiment, yet an industry export volume still up 11% for the year.
During the year, the industry also encountered reputational challenges following allegations of Cesium contamination in October 2025. […] In aggregate, data from the Ministry of Marine Affairs Performance Report indicated that shrimp export volume in 2025 continued to grow by 11% compared to the preceding year.
p. 24 · Read in context →
PT Widodo Makmur Unggas Tbk (WMUU)
A younger Indonesian integrated-poultry player (feed, breeding, DOC, broiler) competing in Japfa's core domestic chain. Its filing sizes the national poultry market, describes the oversupply that pressures every producer's margins, and — through its own sharply shrinking output — illustrates the shakeout underway.
WMUU's sizing of the shared Indonesian poultry market and its central problem — 2025 chicken-meat output of 4.95 million tonnes against 4.76 million tonnes of demand, a persistent surplus it says leaves industry margins 'relatively challenging' and squeezes profitability. (Indonesian original; figures per the Ministry of Agriculture.)
Produksi daging ayam ras nasional mencapai 4,95 juta ton, sementara kebutuhan tercatat sebesar 4,76 juta ton, sehingga terdapat surplus sebesar 189,63 ribu ton. […] Dinamika oversupply ini membuat margin industri perunggasan berada pada level yang relatif menantang, sehingga menekan profitabilitas pelaku usaha.
p. 62 · Read in context →
The competitive shakeout in numbers: WMUU discloses its own feed output collapsed 91% in 2025 to just 1,464 tonnes (from 16,552), a scale of retreat that underlines how the oversupplied market is thinning weaker integrators — the backdrop against which Japfa's feed franchise operates. (Indonesian original.)
Pada tahun 2025, Perseroan dan entitas anaknya memproduksi sebanyak 1.464 ton pakan, mengalami penurunan sebesar 91% dibandingkan 16.552 ton pakan yang dihasilkan pada tahun 2024.
p. 63 · Read in context →
More peer documents
CPF Q4 FY2025 earnings presentation — 51 pages · Management colour on feed-raw-material costs, the shrimp cycle and Vietnam/Thailand swine — read across to Japfa's feed-margin and aqua drivers; earlier quarters (Q1–Q3 FY2025) add the year's cycle. · Open →
PT Malindo Feedmill (MAIN) — financial statements (data feed) — 1 page · Malindo is a direct Indonesian feed-plus-poultry competitor (Sunny Gold brand), but only vendor-sourced financial statements are in the corpus — no narrative filing or transcript to quote, so no exhibit; the income/balance-sheet PDFs are worth opening for head-to-head scale and margins. · Open →
CPF FY2024 annual report — prior-year shrimp market table (p.37) — 289 pages · Prior-year global shrimp production table (Asia incl. Indonesia) for two-year continuity on the aquaculture market CPF and Japfa both address. · Open →
Source: S&P Capital IQ consensus via Xpressfeed · Generated 2026-08-03.
Consensus Tape
The consensus is bullish and still rising for the near year. All 13 covering analysts rate Japfa Buy or Outperform, and FY2027 estimates have been revised up over the past six months — revenue by about 7% and normalized EPS by about 9.6%. Reported revenue has topped consensus in each of the last two quarters by roughly 7%. The caution sits in the outer years, where coverage thins and estimates scatter widely.
Mean Target (IDR)
Analysts, all Buy or Outperform
FY2027E Revenue, 180-day revision
FY2027E EPS, 180-day revision
Source: derived from vendor data.
FY2027 estimates have climbed all year
The clearest signal in the tape is direction, not level: the next full year keeps getting marked up. Over the six months to early August, the FY2027 revenue consensus rose from 66,017 to 70,606 (IDR bn), about 7%; normalized EPS for the same year moved from 370 to 406, up roughly 9.6%. The path is a steady climb rather than one jump — each snapshot sits above the last.
Source: derived from vendor data.
The upgrade is concentrated in the near year. FY2028 consensus has barely moved — revenue sits at 77,766 (IDR bn) against 78,137 three months earlier, and normalized EPS at 424 against 415. The revision cycle is real but shallow-dated: analysts are marking up what they can see, and holding the rest.
Revenue keeps beating the number, lately by about 7%
Reported revenue has come in ahead of the consensus captured just before each print in three of the last four quarters on record, and the two most recent prints are the strongest — each about 7% above consensus. The only recent shortfall was Q2 FY2024. Going further back, revenue also beat in Q4 FY2023 (6.8%) and Q3 FY2022 (3.1%), with mixed results in earlier years. Surprises of this size and sign read as conservative guidance rather than genuine volatility.
Source: derived from vendor data.
Consensus growth: revenue accelerating, EPS cooling
Consensus has revenue growing close to 8% in FY2026 (7.9%) and FY2027 (7.8%), then accelerating to about 10.1% in FY2028, reaching roughly 77,766 (IDR bn). Normalized EPS follows a different curve: up about 11.4% in FY2026 off the strong FY2025 actual of 344, then cooling to about 5.9% and 4.6% in the two years after. The message is that later-year earnings depend on margins holding, not on volume alone.
Source: derived from vendor data. FY2025 is the reported actual; later years are consensus.
Outer-year estimates scatter, and rest on few analysts
Disagreement widens sharply the further out you look. For FY2028 the normalized-EPS estimates run from 230 at the low to 520 at the high — more than double — on just 8 contributing analysts. FY2027 is tighter, 370 to 477 across 10 analysts. One detail helps explain the persistent upward drift: the FY2025 actual of 344 landed above the highest FY2025 estimate of 338, so the near-year numbers have been chasing a company that keeps out-running them.
Source: derived from vendor data.
Every covering analyst rates it Buy or Outperform
Positioning is uniformly positive. All 13 analysts with a recommendation rate Japfa Buy (11) or Outperform (2); none are neutral or negative. Price targets run from 2,450 to 3,700, with a mean of 3,113 and a median of 3,200 — a spread wide enough to matter, but centred well above the low. This source carries no current share price, so no implied upside is stated here.
Source: derived from vendor data.
Visible Alpha broker models via S&P Xpressfeed · 5 brokers · 318 line items · freshest revision 2026-07-20.
Broker Models
Five brokers model Japfa as a poultry-cycle protein producer that has already made its earnings jump: diluted EPS steps up sharply in FY2026, then flattens, as net-income growth decelerates from 16.3% to 7.8% to 1.8% and margins ease from their FY2026 peak. The cleaner, higher-conviction call is the balance sheet, which delevers from 1.38x net debt/EBITDA toward net cash. The sharpest disagreement sits in the FY2027–FY2028 mid-cycle, where diluted EPS fans out from roughly Rp102 to Rp461.
The earnings step-up is already in the numbers
Diluted EPS, FY2026E (Rp)
▲ 301 from FY2025A
EBITDA margin, FY2026E
Return on equity, FY2026E
Net debt / EBITDA, FY2028E
▲ 1.38 from FY2025A
Source: derived from vendor data.
The modelled earnings path is front-loaded. Diluted EPS climbs from Rp301 in the FY2025 actual to Rp353 in FY2026, then barely moves — Rp359 in FY2027 and Rp355 in FY2028. In growth terms the deceleration is unambiguous: consensus net income rises 16.3% into FY2025 and 7.8% in FY2026, then just 1.8% in FY2027, with the FY2028 mean actually dipping (though that reflects one bearish model — see the dispersion below). This is a business the models expect to earn its keep, not to compound.
Source: derived from vendor data.
Margins roll over after FY2026
Every modelled margin line makes the same shape — a peak in FY2026, then a gentle fade. Gross margin runs 20.6%, 20.9%, 20.4%, 19.6% across FY2025 to FY2028; the EBITDA and operating margins trace the same arc, and net margin eases from 6.63% back to 5.96%. Return on equity follows the earnings down, from 19.7% in FY2026 to 15.6% by FY2028. Nothing here suggests structural margin expansion — the brokers see the FY2026 cyclical high giving way to normalisation.
Source: derived from vendor data.
The cleaner story is the balance sheet
Where the earnings call is contested, the deleveraging is not. Net debt/EBITDA falls from 1.38x in FY2025 to about 0.3x by FY2028, and gross debt/EBITDA from 1.65x to 0.48x — with net debt itself modelled to cross into a net cash position by FY2027. Rising free cash flow funds a dividend that holds a roughly 40% payout even as the balance sheet cleans up. The direction is shared, but note the coverage: the leverage ratios beyond FY2026 rest on a single broker, and the two brokers who model net debt disagree widely on the timing of the crossover.
Source: derived from vendor data.
Consumer leads the top line; feed still carries the profit
The growth engine and the profit engine are not the same segment. Consumer products is the fastest grower — up about 14.4% in FY2026 and compounding to the largest four-year gain of any division — yet its modelled operating profit is essentially flat. Feed, growing more slowly, is where the profit accretes, with segment operating income rising across the horizon. Two negatives are worth naming: Aquaculture profit slips, and Trading is modelled at a persistent loss after FY2025. The segment operating-income lines are the thinnest in the feed — one broker beyond FY2025 — so treat the split as indicative.
Source: derived from vendor data.
Source: derived from vendor data.
What lifted FY2026: day-old-chick prices re-rated
The FY2026 earnings step-up has a clear driver in the operating detail. The modelled average selling price for day-old chicks jumps roughly 56% between FY2025 and FY2026 — from about Rp3827 to Rp5961 — before settling into slower gains. Feed prices firm more modestly and feed volumes keep growing, but the poultry-price recovery is what the models lean on for the FY2026 margin peak. These price and volume lines are two-broker estimates.
Source: derived from vendor data.
Where the models split: the mid-cycle call
Headline consensus is tight; the real debate lives in the out-years. By FY2028 the four EPS models span Rp102 to Rp461 around a Rp428 median — the widest fan in the feed — and modelled net-income growth ranges from a 61.3% decline to a 16.4% gain. Free-cash-flow margin and return on equity split the same way once the cycle turns. The disagreement is not about this year's poultry prices but about how long the up-cycle holds.
Source: derived from vendor data.
Headline P&L consensus, momentum and beat/miss live in the CapIQ tab.
The setup
PT Japfa Comfeed Indonesia Tbk (IDX: JPFA) is Indonesia's second-largest vertically integrated poultry and animal-feed producer [1], founded in 1971, listed since 1989, and 55.4%-controlled by Singapore-listed parent Japfa Ltd [2]. FY2025 was a record: revenue of Rp60.7 trillion and profit to owners of Rp4.00 trillion — more than four times the 2023 trough — with 1Q2026 profit up 167% year-on-year [3]. Yet the stock trades near Rp2,210, about 6.4x trailing earnings and below its 2025 year-end close. This report asks whether that gap is opportunity or a correctly-priced peak.
FY2025 revenue (Rp tn)
Profit to owners (Rp tn)
FY2025 EPS (Rp)
Market cap (Rp tn)
Trailing P/E (x)
Consensus target (Rp)
Revenue, profit to owners and EPS: FY2025 audited financial highlights [4]. Market cap and P/E computed at the Rp2,210 close of 3 August 2026 on 11.73 billion issued shares; consensus 12-month target from 13 analysts [5].
What the company actually does
Japfa began in 1971 as a copra-pellet maker, moved into animal feed in 1975, added poultry breeding in 1982, and today runs the full protein chain from feed mill to supermarket shelf [6]. The economics are best understood as one integrated flow: it mills feed, hatches day-old chicks (DOC) under the MB202 brand from Aviagen genetics, raises broilers on commercial farms, processes and brands the meat, and sells the surplus into the open market — with parallel aquaculture (feed and hatcheries) and beef-cattle operations [7].
That integration matters because the segments behave very differently. Commercial farming — live broilers and eggs sold at spot prices — is the largest slice of sales and the most volatile; feed is the smaller, steadier, higher-margin anchor.
Segment net sales, FY2025 financial highlights; the six segments gross to Rp61.9tn before inter-segment eliminations against consolidated net sales of Rp60.7tn [8].
Commercial farming is roughly 40% of sales and feed roughly 25%; together with breeding and processing, the poultry chain is close to 90% of the business [9]. Japfa is a price-taker on broiler prices, corn and soybean-meal input costs, and the rupiah — which is exactly why its profits swing.
The cycle is the story
Revenue has risen every single year, from Rp44.9tn in 2021 to Rp60.7tn in 2025 [10]. Profit did not. Profit to owners collapsed from Rp2.02tn in 2021 to Rp0.93tn in 2023 — an EPS of just Rp80 — then rebounded to a record Rp4.00tn (EPS Rp344) in 2025 [11]. The swing is a margin story, not a demand story: when broiler and DOC prices fall below the cost of corn-based feed, the integrated chain earns very little, and when the supply–demand balance tightens, margins snap back.
Profit for the year attributable to owners of the parent, FY2021–FY2025 audited financial highlights [12].
The recovery has carried into 2026. First-quarter net sales rose 23.6% to Rp17.71tn and profit to owners rose to Rp1.82tn, up from Rp0.68tn a year earlier — roughly 2.7 times [13]. On the company's own arithmetic, the balance sheet is also the strongest it has been: liabilities of roughly Rp20tn against equity of roughly Rp20tn, near 1.0x, after the deleveraging of the past two years [14]. For a reader whose first concern is solvency, that is the important early fact: this is a cyclical, but not a fragile one.
Earnings up, price down
Here is the tension the whole report exists to resolve. Since the 2023 trough, EPS has risen 4.3-fold, but the share price has not kept pace — and it has actually fallen from its 2025 year-end level. The market is paying less for each rupiah of Japfa's earnings today (about 6.4x) than it did at the depths of 2023 (14.8x), even though earnings are now at a record.
Year-end share price, EPS, P/E and market cap for 2023–2025 as disclosed in the FY2025 financial highlights; the final row uses the Rp2,210 close of 3 August 2026 and trailing FY2025 EPS [15].
Two readings fit these facts, and separating them is the job of the chapters that follow. One is that Japfa is a founder-controlled cyclical whose earnings, cash generation and balance sheet have all improved, trading at a trough multiple because the market extrapolates the last downturn — the kind of out-of-favour quality a patient buyer looks for. The other is that a ~6x multiple on record, cycle-peak earnings is precisely what an efficient market pays when it expects the next rupiah of profit to be lower, not higher. The evidence sits on both sides: the counter to the cheap-stock case is that 2025–26 profits may themselves be the peak, and the 6.4x is discounting a normalisation the analysts' Rp3,168 target does not.
Ownership and the question this report answers
The reader's first filter — founder skin in the game — is satisfied at the surface: Japfa Ltd holds 55.4% through Japfa Pte Ltd, the public 43.8%, and the company itself 0.8% in treasury [16]. Control rests with the Santoso family through the Singapore parent, which aligns the controller with the minority on price but also raises the related-party and capital-allocation questions a later chapter should test.
That fixes the spine. The central question this report answers is whether JPFA is a mispriced, founder-controlled cyclical compounder — cheap on record earnings because the market distrusts the durability of the Indonesian poultry cycle — or whether its ~6x multiple is the correct discount for an earnings peak about to roll over. Everything that follows — the three-year financials and forward estimates, the segment margins that drive the cycle, insider ownership and pay, the industry's tailwinds, and what the price implies — is in service of answering it.
Financials and Estimates
JPFA's income statement is cyclical mainly through the margin. Revenue has risen every year for a decade, from Rp27.1tn in 2016 to Rp60.7tn in 2025, while the operating margin swung between 4.3% and 11.7% and dragged reported profit with it [1]. Earnings now convert fully to cash, the balance sheet has deleveraged into the record year, and consensus models a high plateau rather than a fall. This tab lays out the three years of actuals behind the record, plus the forward estimates, and flags where each could break.
FY2025 net sales (Rp tn)
Operating margin
Profit to owners (Rp tn)
Return on equity
Source: FY2025 Annual Report, Financial Highlights and Key Financial Ratios [2].
The cycle lives in the margin
Over ten years JPFA's revenue never fell — not in the 2020 pandemic year, not in the 2023 poultry downturn. What moved was the operating margin, from a 11.7% high in 2016 to a 4.3% trough in 2023 and back to 10.2% in 2025 [3]. Because most of the chain sells live birds, day-old chicks and feed into a spot market, a few percentage points of margin is the difference between a Rp0.93tn profit year and a Rp4.00tn one on a barely-changed top line [4].
Source: FY2025 Annual Report financial highlights [5]; operating income and net sales for FY2016–FY2024 as reported in the audited consolidated financial statements.
The three-year window behind the record is stark. Operating margin ran 4.3% → 9.1% → 10.2%; net profit margin 1.8% → 5.8% → 7.1%; return on equity 6.7% → 19.4% → 21.4%; EPS Rp80 → Rp260 → Rp344 [6]. Gross profit alone rose from Rp7.5tn to Rp13.2tn on cost of goods sold that grew only Rp3.9tn — operating leverage working in the company's favour as broiler and day-old-chick prices recovered against feed cost [7].
Source: FY2025 Annual Report, Financial Highlights [8] and Key Financial Ratios [9].
Earnings that turn into cash
For a reader whose first calibration is bankruptcy risk, the more useful test than reported profit is whether that profit becomes cash. Across FY2021–FY2025 JPFA generated Rp14.4tn of operating cash flow against Rp12.1tn of total net profit — cumulative cash conversion of about 1.19x [10]. The record is not smooth: in the 2021 expansion, operating cash flow was only Rp0.7tn against Rp2.1tn of profit as working capital and biological inventory built; in the 2023 trough, cash ran well ahead of earnings as that working capital released [11]. Over a full cycle, though, the profit is real cash, not an accrual.
Source: FY2025 Annual Report, Consolidated Statement of Cash Flows [12]; free cash flow derived as operating cash flow less capital expenditure.
Free cash flow tells the capital-intensity story. It was negative in FY2021 and FY2022 while the group spent Rp1.3tn–Rp2.1tn a year on capacity, then turned firmly positive: Rp3.2tn in FY2024 and Rp2.5tn in FY2025 after Rp2.5tn of capex [13]. The five-year cumulative is about Rp4.9tn of free cash — enough to cover the Rp0.8tn–Rp0.9tn paid out in dividends each of the last two years with room to spare [14]. The counter-fact worth keeping: this is peak-margin cash. In a repeat of 2021–2022, feeding the working-capital cycle can turn free cash flow negative even without a loss.
Balance sheet: deleveraged into the record
JPFA ended FY2025 with total equity of Rp20.0tn against Rp20.0tn of total liabilities — a total-liabilities-to-equity ratio of 1.0x, down from 1.4x in 2023 — and interest-bearing-debt-to-equity of 0.6x, down from 0.9x [15]. Gross interest-bearing debt of roughly Rp11.9tn, set against Rp3.6tn of cash, leaves net debt near Rp8.3tn — about 0.4x equity [16]. For a business earning a 21% return on that equity, solvency is not the near-term question.
Cash (Rp tn)
Net debt (Rp tn)
Net debt / equity
Current ratio (x)
Source: derived from FY2025 Annual Report — cash and borrowings detail [17] and disclosed ratios [18].
One line does deserve a pause. The current ratio fell from 1.8x to 1.3x, and current liabilities jumped 78% to Rp16.5tn [19]. Almost all of that is one item: the US$350 million 5.375% Sustainability-Linked Bond, issued in 2021 and maturing 23 March 2026, reclassified from long-term to current — Rp5.8tn [20]. It is not distress, and it is funded two ways: the company built its cash balance 162% to Rp3.6tn, holding US dollars specifically to repay the bond [21], and it arranged bank facilities expressly to refinance the US$350 million notes falling due 21 March 2026 [22].
The 1.3x current ratio and the 78% jump in current liabilities are a single known maturity: the US$350m March-2026 bond, backed by a Rp3.6tn cash build and committed refinancing facilities — not a liquidity strain. Stripping the bond out returns the current ratio to roughly 2.0x.
Stripping the reclassified bond out of current liabilities returns the current ratio to about 2.0x — the level of the prior two years [23]. The live confirmation is the 30 June 2026 statement, not yet published at the time of writing, which will show the bond settled.
Dividends track the cycle
JPFA pays out on a policy of roughly a third to a half of profit, so the dividend rises and falls with the margin. Dividend per share ran Rp20 for FY2019 (a 13% payout), Rp40 for FY2020 (51%), Rp60 for FY2021 (35%) and Rp50 for FY2022 (41%) [24][25], before the recovery lifted the FY2024 distribution to a record Rp140 — a 55% payout, Rp1.63tn in total [26].
Source: FY2021 [27], FY2023 [28] and FY2025 [29] Annual Reports. FY2023 (trough EPS Rp80) omitted; the FY2025 dividend is set at the 2026 AGM.
On the same ~50% policy, FY2025's record EPS of Rp344 points to a materially larger distribution once declared, and the cash-flow statement already shows Rp0.86tn of dividends actually paid during 2025 [30]. The reader's own margin-of-safety test cuts both ways: the yield is real but variable, and a down-cycle would shrink it exactly when the share price is likely weakest.
What consensus expects
Thirteen sell-side analysts carry a "Strong Buy" and a mean 12-month target of Rp3,168, about 43% above the 3 August 2026 close of Rp2,210 (Company and Cycle sets out the price history). Their forward numbers, though, describe a plateau, not another leg up: net sales of Rp65.5tn / Rp70.6tn / Rp77.8tn and EPS of Rp383 / Rp406 / Rp424 for FY2026–FY2028, growth decelerating to mid-single digits by FY2028.
Source: FY2025 actual from the Annual Report [31]; FY2026–FY2028 consensus from StockAnalysis and MarketScreener, snapshot 23 July 2026 (as reported). Forward P/E computed on the 3 August 2026 close of Rp2,210.
Two things sit in tension inside these numbers. First, consensus and the market disagree about the same company: analysts model EPS holding above Rp380 through 2028, which would put the stock at roughly 5x forward earnings, yet the market pays about 6x trailing and trades below the 2025 year-end close [32]. If the plateau holds, the multiple is low for the earnings; if 2025–2026 is the cycle peak, a low multiple on peak earnings is the ordinary result. Second, the FY2026 consensus of Rp383 already looks conservative against a trailing-twelve-month EPS of about Rp442 struck after a first-quarter 2026 in which profit to owners roughly tripled year on year — the estimate may lag the most recent print rather than lead it.
What would change the read
The read is most sensitive to where the operating margin settles. The mid-cycle of the last decade sat closer to 6–8% than to the 10.2% of FY2025; a reversion toward that band would pull EPS back toward Rp150–Rp250 and make today's ~6x trailing multiple fair rather than cheap. The evidence for durability is that the recovery held for two full years and that revenue mix keeps shifting toward processed and consumer products (Rp10.6tn in FY2025, the fastest-growing segment) [33]. The evidence against it is that the margin has round-tripped this far before. The near-term tells are the 30 June 2026 consolidated statement due in August 2026 and Indonesian day-old-chick and broiler spot prices against the corn and soybean-meal cost that drives the whole chain — the segment mechanics a later chapter should take up.
Segment Economics
JPFA's record FY2025 operating profit is the sum of five very different businesses. Feed and processing form a steady core that earned about Rp3.6 trillion of segment result and has not dropped below Rp2.7 trillion in four years. The breeding and commercial-farm units are a separate, price-cyclical layer that lost money as recently as 2023 and swung to roughly Rp3.1 trillion in 2025 — helped by government-directed supply cuts. That split is where the durable-versus-peak question is decided in the numbers.
Five businesses under one roof
The consolidated operating margin that swung from 4.3% in 2023 to 10.2% in 2025 [1] is an average across segments that behave nothing alike. Animal Feed is the largest, at 39.0% of FY2025 revenue, followed by Commercial Farm at 31.0%, Poultry Processing and Consumer Products at 11.0%, and Aquaculture at 6.0% [2]. Revenue share, though, is a poor guide to where the profit swing lives.
The company reports a segment result — an operating profit — for each. The FY2025 picture shows a feed business roughly seven times the size of processing by profit, an aquaculture unit growing faster than any of them, and a breeding segment that fell even as the group hit a record.
Sources: FY2025 Annual Report, Business Segment Review — Animal Feed [3], Poultry Breeding [4], Commercial Farm [5], Processing and Consumer Products [6], Aquaculture [7]. Segment results are struck before inter-segment eliminations and unallocated corporate costs; consolidated operating profit was Rp6.18 trillion.
The pillar: feed passes its costs through
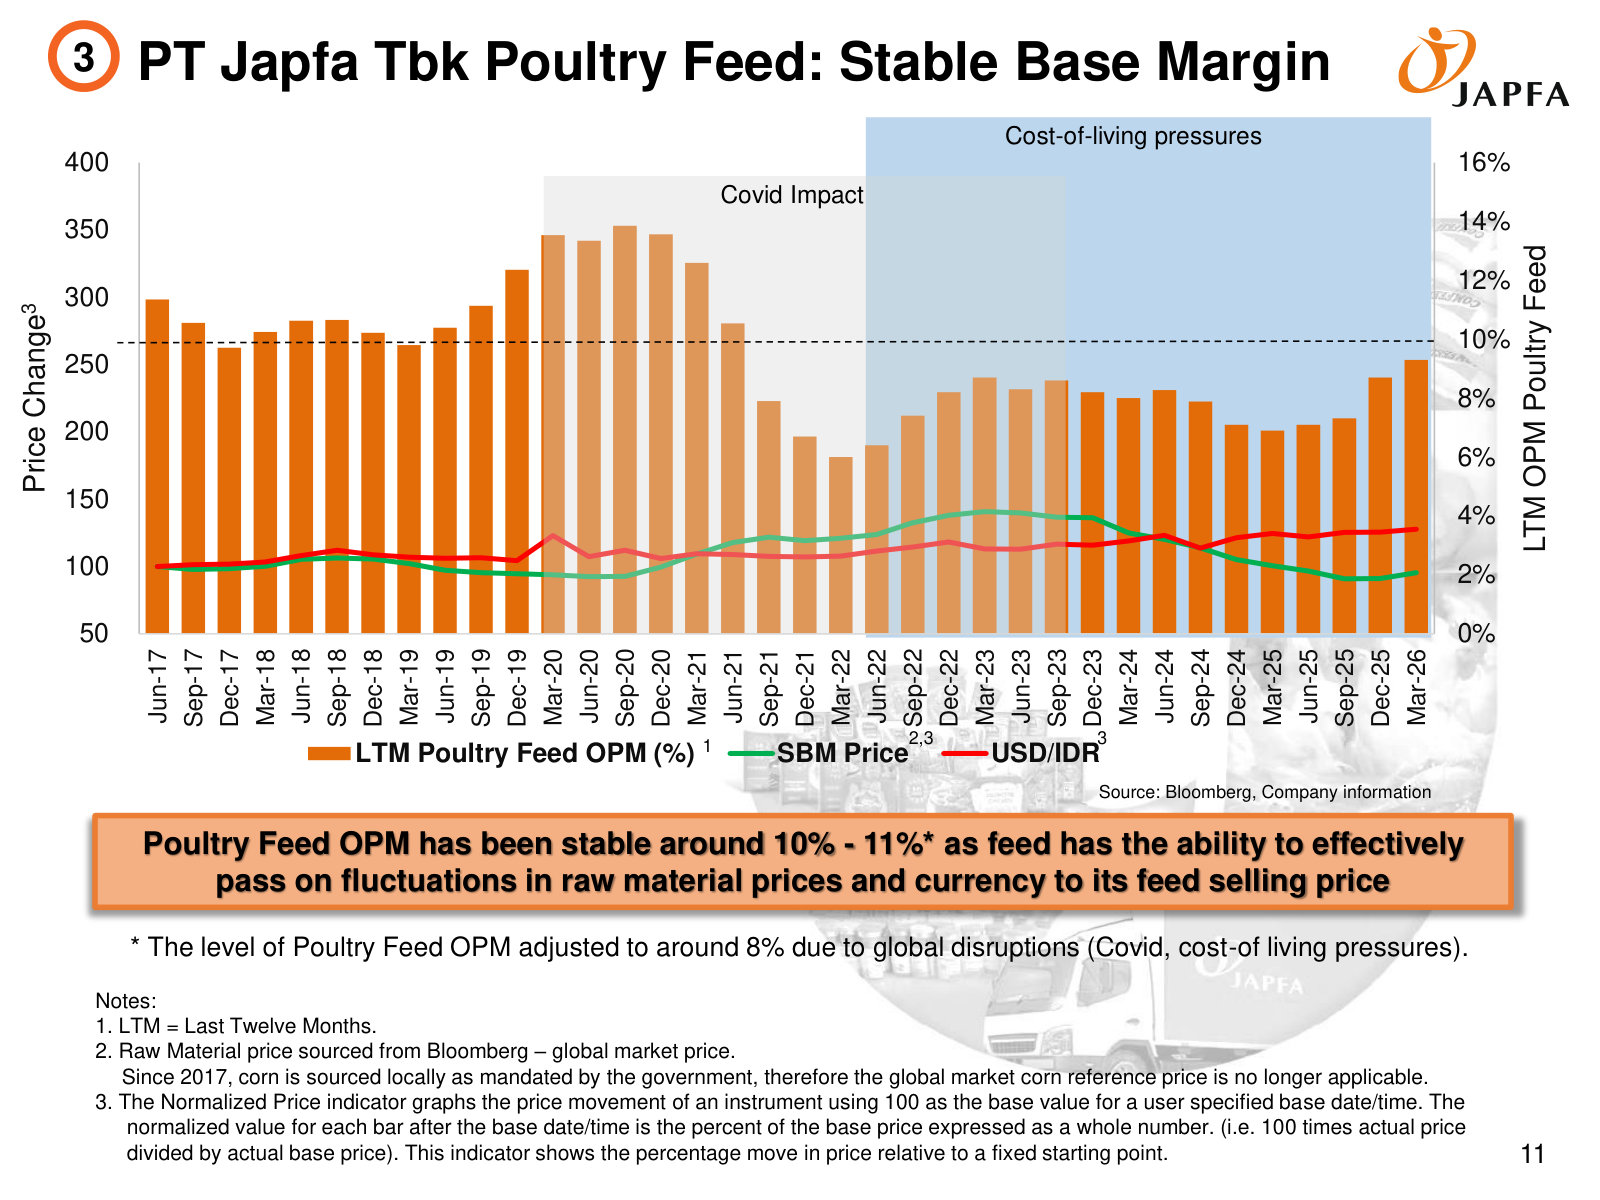
Animal Feed is the reason the group does not lose money at the bottom of the cycle. Its operating margin held at 8.2%, 8.2%, 7.1% and 8.7% across FY2022–FY2025 [8] — a flat line through the same years the group's overall margin more than doubled. Management's stated mechanism is pass-through: feed prices are reset to carry raw-material and rupiah moves into the selling price, which is why the feed margin holds "even during the periods of Rupiah volatility and the poultry market downturn" [9].
The feed input is not the global grain market it once was. Since 2017 corn has been sourced locally under a government mandate, so the imported reference price no longer sets feed cost [10]; soybean meal remains imported, mainly from South America. In FY2025 the feed segment's result rose 31.7% to Rp3.1 trillion on a 7.0% sales increase [11] — profit grew far faster than sales because the margin widened, not because volume surged.
The swing: broiler farming
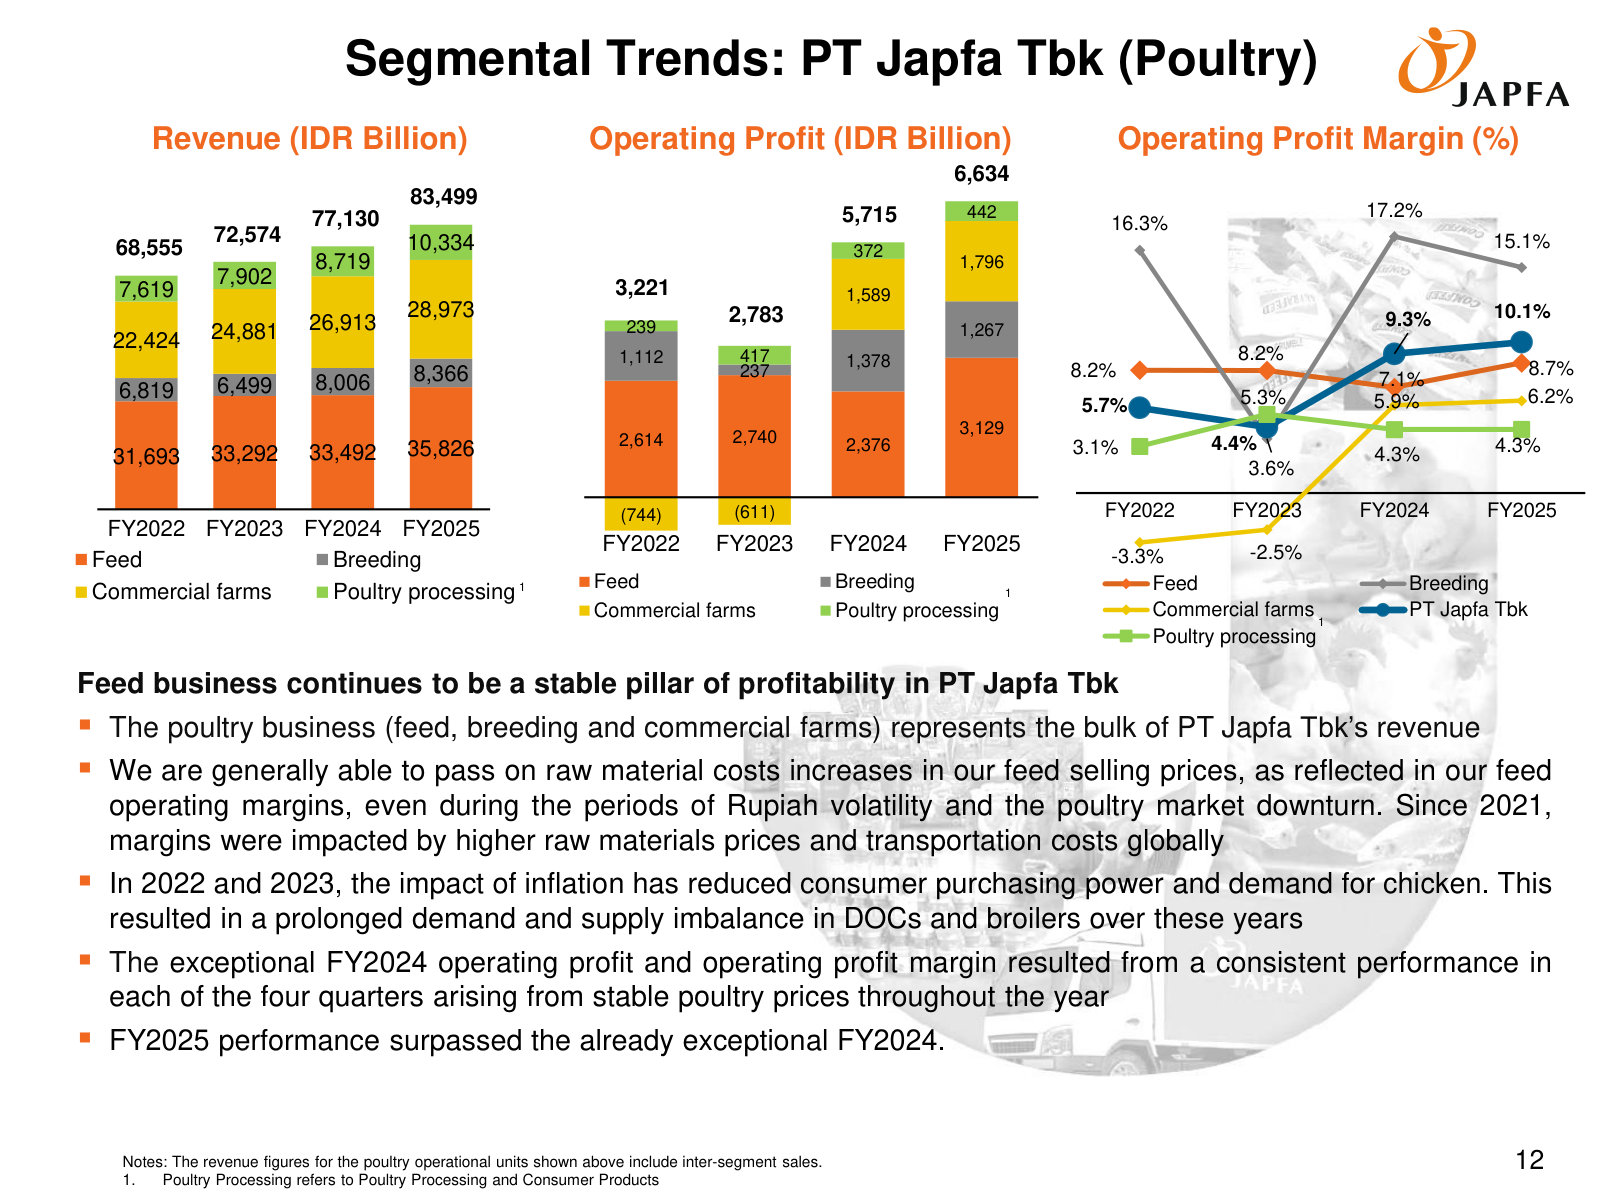
The cyclicality sits almost entirely in two downstream-of-feed units. Commercial Farm — raising and selling live broilers — lost Rp744 billion in 2022 and Rp611 billion in 2023, then earned Rp1,589 billion in 2024 and Rp1,796 billion in 2025. Poultry Breeding, which sells day-old chicks, ran at a 3.6% margin in 2023 before recovering [12]. In the company's own words, commercial farming "has returned to profit in FY2024 after recording losses over the last 3 years" [13].
Source: FY2025 Investor Presentation, Segmental Trends (Poultry) [14].
The chart makes the point the average hides: feed is a near-horizontal line around 8%, while the commercial-farm margin crosses from negative territory to roughly 6%. A few points of broiler margin, applied to a segment turning over Rp29 trillion of sales, is most of the difference between a trough year and a record.
What actually moves the broiler price
Broiler and day-old-chick prices "are prone to fluctuation according market demand/supply dynamics," which the company names as the reason segment profit moves between quarters. The FY2024–FY2025 recovery is attributed to "the balanced demand and supply dynamics of DOCs through import quotas and culling initiatives," which "helped stabilize poultry prices in the market" [15]. Prices firmed in part because supply was administratively restrained.
That lever is documented. In April 2025, facing low farm-gate live-bird prices and a potential surplus of day-old chicks, the Ministry of Agriculture issued a circular advising JPFA to cut fertile hatching eggs at 19 days of incubation and to early-cull parent-stock breeders at 54 weeks of age across Java, Sumatra and Sulawesi; the company implemented the measures in full [16]. Regulation works both ways: the same industry review flags that "the balance of DOC supply and demand, the rising layer population, and broiler production management must be carefully maintained to prevent oversupply," and that demand rests partly on the government's free-nutritious-meal (MBG) programme and on consumer purchasing power [17]. Prices propped up by supply controls can weaken if those controls are relaxed.
The downstream edge is real, and separate
Two segments improved for reasons that look structural rather than cyclical. Poultry Processing and Consumer Products — branded and further-processed food through Ciomas and Japfa Food Indonesia — grew its result 18.8% to Rp441.6 billion on an 18.5% sales rise [18]. Aquaculture grew its result 45.9% to Rp521.7 billion [19]. Neither is a commodity-broiler bet, and both carry the mix further downstream — the direction management says it intends to keep pushing. They are smaller than the poultry chain, but they are growing off the cyclical layer, not with it.
Reading the record: how much is durable
Splitting the poultry chain into its two behaviours is the most useful lens on the FY2025 result. A stable core — feed plus processing — earned Rp2.9 trillion, Rp3.2 trillion, Rp2.7 trillion and Rp3.6 trillion of segment result across FY2022–FY2025: a floor that never fell far. A cyclical layer — breeding plus commercial farming — went from Rp0.4 trillion in 2022 to minus Rp0.4 trillion in 2023, then to Rp3.0 trillion in 2024 and Rp3.1 trillion in 2025.
Source: derived from segment operating profit in the FY2025 Investor Presentation, Segmental Trends (Poultry) — stable core = feed + processing, cyclical layer = breeding + commercial farming [20].
The read that follows: of the poultry chain's roughly Rp6.6 trillion FY2025 operating profit, a little over half is the steady core and a little under half is the cyclical, supply-managed layer that was negative two years earlier. A full reversion to the 2023 pattern would not erase the group's profit — the core and the growing downstream units would remain — but it could take a third or more out of operating profit without revenue falling at all. The consolidated Rp6.18 trillion the market is capitalising at a single-digit multiple (Financials and Estimates) is, on this decomposition, part annuity and part broiler-price wager [21].
Stated as one line: At Rp2,210 JPFA is ~6.4x record and only ~8.5x mid-cycle earnings because its whole margin cycle sits in one commercial-farm unit that swung from a Rp611bn loss in 2023 to a Rp1,796bn profit in 2025 — a ~46%-of-poultry-profit layer whose FY2024-25 recovery the company credits to government import quotas and culling — while the feed margin barely moved from 8.2% to 8.7% [8][15].
The strongest fact against reading the record as a peak: the cycle had not turned as of early 2026. Breeding and commercial farming "continued to report profits in 1Q2026 driven by growth in volume and stable ASPs of DOC and broiler," with quarterly EBITDA roughly double the year-earlier period [22]. What would change the read in either direction is narrow and checkable: the commercial-farm segment result drifting back toward breakeven, or the government relaxing the culling and import-quota controls that have propped up prices, would confirm the cyclical case; continued farm-level profitability through a full year without fresh supply cuts would argue the downstream mix shift has genuinely lifted the floor.
JPFA is controlled by the Santosa family, which owns 55.4% through Japfa Pte Ltd and in 2025 took the group's Singapore parent private — leaving JPFA the only listed entry to the family's agri-food empire. Executive equity is negligible and board pay is modest, about Rp189 billion or 4.7% of profit. The material related-party channel is roughly Rp7 trillion a year of feed inputs bought through an affiliate, Annona — the related-party channel a margin-of-safety buyer has to price.
A family control block, and a parent that just went private
One shareholder owns the company. Japfa Pte Ltd held 6,500,176,516 shares, or 55.4%, at 31 December 2025; the public float was 43.8% and treasury stock 0.8% [1]. That block has been stable through the whole cycle this report has traced, and it sits above JPFA in a chain that runs to Japfa Ltd, the pan-Asian agri-food group, and ultimately to the family of the late founder, Handojo Santosa.
Source: FY2025 Annual Report, Shareholder Structure and Composition (Japfa Pte Ltd controls 55.4%) [2].
What changed in 2025 sits one level up. The family took Japfa Ltd private and delisted it from the Singapore Exchange, through joint offerors TAC 1 and TAC 2 owned by Renaldo Santosa, Gabriella Santosa and Rachel Anastasia Kolonas — children of the founder — at S$0.62 a share, with shareholders approving in April 2025 and the delisting following in mid-2025, as reported by The Jakarta Post and Reuters. The consequence for a JPFA minority is structural: the controlling parent is now wholly family-owned and unlisted, and JPFA — still on the IDX with a 43.8% public float — is the only place a public investor can own this family's poultry franchise. Two of the three offerors, Renaldo and Gabriella Santosa, sit on JPFA's own Board of Directors, and Commissioner Hendrick Kolonas is affiliated with the same control block.
The directors who run the business hold almost no stock themselves. The President Director, Renaldo Santosa, is 35, domiciled in Singapore, and has spent his career inside the Japfa group; he was appointed in 2023 [3]. The individual directors hold almost no stock directly — Leo Handoko Laksono 1,000,000 shares (0.01%), Rachmat Indrajaya 164,800 (0.00%), and the departed Vice President Director Tan Yong Nang 380,000 (0.00%) [4]. There was no MSOP or ESOP grant in 2025, and the company forbids loans to directors and commissioners [5]. Alignment here flows from the 55.4% family block, not from equity in the hands of the people running the business day to day.
Modest board pay
Board compensation is small against the profit it oversees. The Board of Directors received Rp88.5 billion in 2025 and the Board of Commissioners Rp100.5 billion, Rp189 billion together [6] — about 4.7% of the Rp4.00 trillion profit attributable to owners, or 0.3% of Rp60.7 trillion of sales. That aggregate ties out to the audited related-party note, which records key-management remuneration of Rp189,045 million. For a family-controlled emerging-market name, that is restrained; there is no equity-based pay layer inflating it, and the directors' package is salary, allowances, bonus and post-employment benefits, with the commissioners on salary and allowances only [7].
Board of Directors (Rp bn)
Board of Commissioners (Rp bn)
Total board pay (Rp bn)
Share of FY2025 profit
Source: FY2025 Annual Report, Remuneration Structure for the Board of Commissioners and Board of Directors; share of profit computed against Rp4.00tn profit to owners [8].
The notable feature is direction. The supervisory Board of Commissioners — the body that oversees, rather than runs, the Rp60.7 trillion operation — is paid more in aggregate than the executive Board of Directors. Part of the explanation is who sits on it: the President Commissioner, H. Syamsir Siregar, is 84 and a former head of Indonesia's State Intelligence Agency, in the seat since 2010 [9], and the board also carries a former senior police officer as Independent Commissioner. A supervisory board weighted toward senior former officials is a common Indonesian pattern; it is worth seeing, not because the sums are large, but because the value on this board is relationships rather than operating equity.
Where value could route to the controller: Annona
A minority's exposure to the controller concentrates in the related-party trade, and that trade sits in one line. JPFA buys the bulk of its feed raw materials through Annona Pte Ltd, an affiliate under the same ultimate ownership: purchases from Annona were Rp7,046 billion in 2025, down from Rp8,007 billion in 2024, and all related-party purchases together came to Rp7,124 billion, or 11.7% of consolidated net sales [10]. Against roughly Rp47 trillion of cost of goods sold, that single affiliate supplies close to a seventh of the group's input cost. This is the channel through which margin could, in principle, be routed to the controlling family before it ever reaches JPFA's income statement.
Source: FY2025 audited consolidated financial statements, Note 36 Related Parties Balances and Transactions [11] [12].
Three things temper the concern. The Annona flow is falling, not rising — down 12% in rupiah year on year and from 14.4% to 11.7% of sales [13]. Everything else is small: related-party sales were Rp447 billion (0.7% of sales), and the management-services agreement with Annona Technical Services, which supplies finance, legal and HR support, cost Rp71 billion in G&A — about one-tenth of one percent of revenue [14]. And the cash that most visibly leaves for the controller — dividends — leaves pro rata to every holder: the Rp70-per-share interim on 2024 earnings distributed Rp813,937 million, of which the family's 55.4% took roughly Rp451 billion and the public float the rest [15].
What is not visible is the price test. The filings disclose the Annona volumes but not a benchmark against which to judge whether JPFA pays an arm's-length price for its imported feed inputs; the note asserts the relationship without a comparison. That is the standing gap. What that unbenchmarked price is worth — the year-end payable to Annona as a financing leg, and how the purchase line tracks the commodity cycle — is developed in The Annona Price Test.
Reading the control picture
On the evidence, control at JPFA looks aligned rather than extractive: the family owns a majority stake and buys shares of the same dividend stream as the float, pay is modest and equity-free, and the largest related-party line is shrinking. The strongest fact against that read is the one the filings cannot close — Rp7 trillion of annual feed sourcing through a wholly family-owned affiliate, priced by disclosure rather than by an observable benchmark, now sitting beneath a parent the family took private in 2025. For a buyer whose case leans on a low multiple and a wide margin of safety, this is the governance line to keep marked: the read would change if the Annona purchase share began climbing again, if the management fee stepped up faster than revenue, or if a future action treated JPFA's minorities differently from its controller. None of those is visible today; all three are worth watching in the 30 June 2026 accounts.
The Annona Price Test
JPFA buys roughly Rp7 trillion of imported feed raw material each year — close to a seventh of its cost of goods sold — through Annona Pte Ltd, a Singapore affiliate under the same family control. The audited note discloses the volumes but publishes no price against which to judge them. Tested against observable feed-commodity prices, the channel's spend rises and falls with the global grain cycle, which is how an arm's-length pass-through should behave — but the price is unbenchmarked, and it is among the most consequential numbers a skeptic cannot independently check.
Why the feed purchase line is material
The ownership chapter (Ownership and the Parent) established the plumbing: the Santosa family controls 55.4% of JPFA, took the group's Singapore parent private in 2025, and routes the bulk of JPFA's feed inputs through Annona. What that chapter flagged and left open was the price test — the note asserts the relationship but offers no benchmark. This chapter runs it.
The reason the line matters is arithmetic. In FY2025 JPFA earned Rp13,191 billion of gross profit on Rp60,716 billion of net sales, against Rp47,524 billion of cost of goods sold [1]. Cost of goods sold is 78% of sales, and the Annona feed purchase — Rp7,046 billion in FY2025 — is 14.8% of that cost base [2]. Corn and soybean meal are the two inputs that most move JPFA's cost of goods sold, and both are bought in [3]. Because net margin is thin — profit to owners was Rp4,004 billion, or 6.6% of sales [4] — a small percentage wedge on the feed line converts into a much larger percentage of profit.
Annona feed buy FY25 (Rp tn)
Share of cost of goods sold
Owed to Annona (Rp tn)
Share of total liabilities
Source: FY2025 Annual Report, Note 36 Related Parties [5] and trade-payables schedule [6]; cost of goods sold from the FY2025 income statement [7].
The indirect check the note allows
The audited related-party note names Annona as a party whose shareholders, directly or indirectly, are the same as JPFA's majority shareholder, and lists the transaction values — but it carries no price comparison [8]. The available check is indirect: if Annona charges JPFA an off-market price, its total spend should decouple from where feed commodities actually trade. It does not.
Across five years the Annona feed purchase tracks the commodity cycle. It rose from Rp7,457 billion in FY2021 to a peak of Rp9,472 billion in FY2022 — the year global grain and oilseed prices spiked after the invasion of Ukraine, and the year JPFA's own margin troughed — then fell back to Rp7,046 billion by FY2025 as those prices normalised [9] [10] [11]. As a share of cost of goods sold the same line fell from 22.9% in FY2022 to 14.8% in FY2025 — the channel is shrinking in the mix, not expanding into it.
Source: related-party notes, FY2022 Annual Report Note 35 [12], FY2023 Annual Report Note 35 [13] and FY2025 Annual Report Note 36 [14].
Source: related-party notes across the FY2021–FY2025 annual reports [15] [16] [17]; percentages of cost of goods sold are derived against reported COGS.
The direction is corroborated by two independent readings of the feed market. JPFA's own FY2025 review attributes its higher cost of goods sold to volume growth "amid improving raw material costs" — the input line got cheaper per unit [18]. And regional peer Charoen Pokphand Foods, which discloses actual feed-ingredient prices, records soybean falling from 20.9 to 15.8 Baht per kilogram between 2024 and 2025 — a 24% drop — with maize roughly flat and fishmeal down 13%, on lower agricultural commodity prices worldwide [19] [20]. Annona's 12% year-on-year decline in rupiah spend sits within that price move once volume growth is added back.
Source: Charoen Pokphand Foods FY2025 Annual Report, feed raw-material price table [21].
What the aggregate test cannot settle
Matching total spend to the commodity cycle shows the channel is not wildly off-market. It cannot rule out a steady markup embedded in every year — a constant few-percent skim would move with prices too, and would not show up as a trend break. JPFA discloses Annona's rupiah spend but not the tonnage behind it, so a true unit-price comparison is not possible from the filings.
Two cross-checks bound the concern. The first is margin: if Annona were quietly overcharging for a seventh of the cost base, JPFA's profitability would sit structurally below peers that buy feed at market. Instead JPFA's FY2025 operating margin of 10.2% is near a decade high, and its feed-and-processing core earns returns in line with the sector (Segment Economics). A channel said to leak margin does not easily coexist with record margins. The second is the reverse risk. Annona could as plausibly be undercharging — subsidising the listed vehicle to flatter its optics — but there is no evidence of that either, and it would cut in minority holders' favour, not against them.
The sensitivity frames what is at stake. Every one percentage point of price wedge on the FY2025 Annona purchase is worth about Rp70 billion before tax, or Rp55 billion after JPFA's 22% effective rate — 1.4% of profit to owners. A 5% wedge, the outer edge of what could hide inside an unbenchmarked import price, would be Rp275 billion after tax, or 6.9% of owners' profit [22] [23]. Material to a value that leans on a wide margin of safety, but short of existential — this is a haircut-to-earnings-quality risk, not a solvency one.
Source: derived from the FY2025 Annona purchase of Rp7,046 bn [24] against FY2025 pre-tax profit Rp5,484 bn and profit to owners Rp4,004 bn [25].
The financing leg runs the other way
The related-party relationship is not only a cost channel; it is also a source of funding, and that leg favours minorities. At the end of FY2025 JPFA owed Annona Rp2,124 billion of trade payables — 10.6% of total consolidated liabilities [26]. That is roughly three months of Annona purchases carried as supplier credit from the parent group. Priced at JPFA's cost of funds, interest-free trade credit of that size is worth on the order of Rp150 billion a year of financing that the controller extends to the listed company rather than extracts from it. The separate management-services agreement with Annona Technical Services runs the opposite way but is small — Rp71 billion of finance, legal and HR fees in FY2025, about one-tenth of one percent of revenue [27]. The concern with the payable is concentration and rollover, not leakage: it is a low-cost funding line that would become a liquidity question only if the parent chose to shorten terms.
The read, and what would change it
On the evidence available, the Annona channel behaves like a market pass-through rather than an extraction lever: its spend tracks feed-commodity prices through the cycle, it is shrinking as a share of cost, record group margins are hard to square with a large hidden markup, and the balance-sheet leg supplies funding to minorities rather than draining it. The strongest fact against that read is what the filings cannot close: a seventh of the cost base priced by disclosure rather than by an observable benchmark, now sitting beneath a parent the family took private, with the earnings sensitivity to a plausible wedge running to several percent of profit.
That read would change if the coming disclosures broke the pattern the test relies on: the Annona purchase share climbing again while feed-commodity prices fall, a management fee stepping up faster than revenue, or the group's feed-segment margin drifting below peers with no market explanation. The 30 June 2026 accounts, due shortly, are the next place to check each. Until one of those appears, the durability of JPFA's peak margin can be taken at close to face value on this line — with this pricing question marked as the item a margin-of-safety buyer keeps under review, not closed.
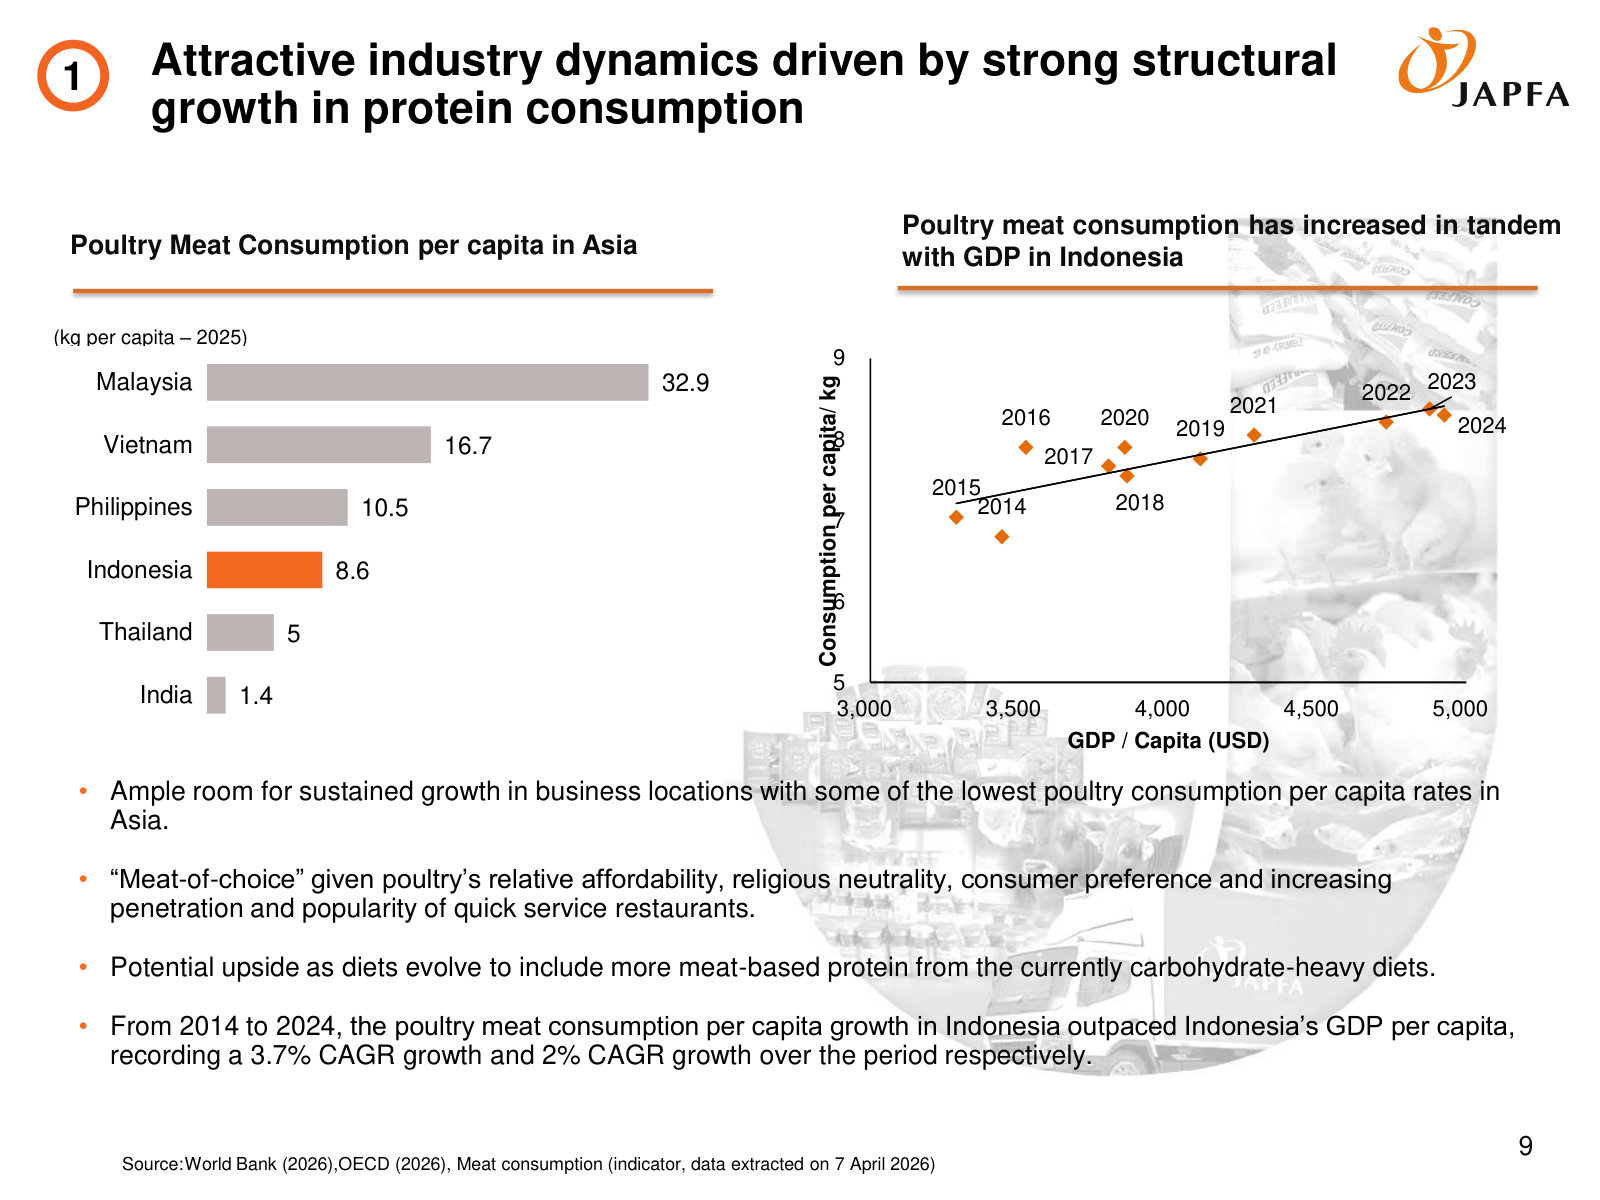
The demand case for JPFA is real but slow, and now carries one large policy accelerant. Indonesians eat only around 8 kg of poultry a head — a fraction of Malaysia's — and that figure has crept up with income at roughly 2.6% a year, not leapt [1]. The government's new free-meal programme (MBG) adds a large near-term boost, but its 2026 budget was cut by a fifth after execution problems [2]. This is a floor under volume, not a growth engine.
The gap that sets the ceiling
Every JPFA investor deck opens the growth argument the same way: a bar chart of poultry consumed per person across Asia, with Indonesia near the bottom. On the company's 2024 numbers, Indonesia consumed about 8.4 kg a head against Malaysia's 50.5, Vietnam's 17.6 and the Philippines' 14.6 [3].
Source: JPFA investor presentation, 31 October 2024, p.10 [4].
Treat the absolute number with care. The level of Indonesian poultry consumption depends heavily on the source and the definition: JPFA's OECD-basis figure is about 8 kg, while Indonesian statistics-agency measures of dressed-chicken consumption run higher, in the low-to-mid teens. The company itself quietly revised the whole series in its 2025 decks — Malaysia dropped from 50.5 to 31.1 kg and Thailand from 8.2 to 4.7, apparently on a source change, while Indonesia held near 8.3 [5]. What survives every revision is the direction: Indonesia consumes several times less poultry per head than its richer neighbours, and that gap is the structural headroom the whole bull case rests on. The company has made the same point for years — its FY2021 report already flagged that "low consumption of beef, chicken and fish in Indonesia indicates strong potential growth" [6].
A slow escalator, tied to income
The gap is real; the question is how fast it closes. JPFA's own data answers plainly: poultry consumption tracks GDP per capita, and Indonesia's income has risen gradually. Consumption climbed from roughly 6.5 kg a head in 2013 to 8.4 kg in 2023 — about 2.6% a year, punctuated by a pandemic dip [7].
Source: JPFA investor presentation, 31 July 2025, p.10 (consumption-vs-GDP series) [8].
Underneath that escalator sit the demographics investors buy Indonesia for: a population near 280 million, a young workforce, and a middle class that peer producer Widodo Makmur Unggas pegs at about 47.85 million people, or 17.13% of the population, and names as "the primary driver of increased poultry meat consumption" [9]. Bank Indonesia expects the economy to grow 4.9–5.7% in 2026 [10]. None of this is dramatic, but it is durable: a rising-income, protein-short market where the base case is more chicken eaten every year. That slow compounding is what turns JPFA's volume-driven feed and breeding businesses — where revenue has risen every year to Rp60.7 trillion — into a genuine long-duration franchise rather than a pure commodity trade (see Company and Cycle).
The accelerant: a Rp335 trillion free-meal programme
What is new, and what management now leads with, is policy. President Prabowo's Free Nutritious Meals programme (Makan Bergizi Gratis, MBG) — launched on 6 January 2025 — puts free protein-rich meals into the hands of schoolchildren, toddlers and pregnant and nursing mothers, exactly the affordable-protein demand JPFA is built to supply. JPFA has cited it as a demand driver in two straight annual reports, saying in FY2024 that animal-protein consumption "is projected to rise, supported by the implementation of a government programme providing Free Nutritious Food" [11], and reaffirming its support in FY2025 [12].
The scale is the point. The 2026 state budget originally set aside Rp335 trillion for MBG, targeting 82.9 million beneficiaries through about 30,000 kitchens — up from 17.9 million people and fewer than 2,000 kitchens in the programme's first half [13]. By mid-2026 it was already feeding more than 60 million people [14].
2026 MBG budget (initial)
Target beneficiaries
Target kitchens
Reached by mid-2026
Sources: ANTARA News, 2026 budget allocation [15]; Cabinet Secretariat, beneficiary count [16].
Even a modest protein share of a programme this size is material set against a domestic broiler market this small. It is also the clearest reason a plateau in JPFA's forward earnings — flat-to-slightly-up EPS through 2028, as the Financials and Estimates chapter laid out — is a plausible base case rather than a rollover: incremental government-funded demand helps absorb the supply the industry keeps adding.
Limits on the MBG tailwind
MBG is a tailwind that warrants conservative sizing, because its own first year exposed how fragile a fast-scaled state programme can be. Three problems stand out, all from 2025–26.
- The budget is already being cut. Facing fiscal pressure, the government trimmed the 2026 allocation by Rp67 trillion — a fifth — from Rp335 trillion to Rp268 trillion [17]. The headline demand number is a moving target set by the Treasury, not a contract.
- Execution has been poor. By 31 October 2025 more than 16,000 pupils had been recorded as sickened by MBG meals, and hundreds of kitchens have halted on funding delays and safety failures [18].
- Governance is under a cloud. The programme's former head was arrested and the scheme placed under an "efficiency" review amid a corruption probe [19].
None of this touches JPFA's balance sheet — the company sells protein into a broad market and does not depend on any single buyer. But it means the marginal demand MBG adds is politically and fiscally contingent, and could be scaled back as fast as it was scaled up. The structural, income-driven escalator is the base case; the MBG programme is an upside kicker that warrants a heavy discount.
What would change this read
The demand thesis strengthens if per-capita consumption breaks above its ~2.6% trend as MBG kitchens reach full coverage, or if the middle class expands faster than GDP — either would lift the volume base the Segment Economics chapter identified as the thing government supply controls must manage toward. It weakens if MBG is quietly wound down under fiscal strain, or if consumption stalls near 8 kg as it briefly did in 2017–19. For a buyer demanding a margin of safety, the reassuring part is that the base case needs no heroics: a protein-short country growing its income at 5% a year does not require a free-meal programme to keep eating more chicken. The programme is what could turn that slow grind into a faster one — not what holds it up.
Valuation and Peers
At Rp2,210 JPFA trades on about 6.4x its record FY2025 earnings, 5.0x the trailing twelve months, and 5.8x forward consensus — cheap in absolute terms. But most of that cheapness is not JPFA's own: the entire Indonesian poultry complex has de-rated from 20–35x a few years ago to single digits, and JPFA sits mid-pack, at a persistent discount to sector leader CPIN. On mid-cycle rather than peak earnings, the discount shrinks to roughly 8.5x.
The price in numbers
Share Price (Rp)
Market Cap (Rp tn)
P/E on FY2025 EPS (x)
Forward P/E (x)
Dividend Yield
Sources: share price and yield per market data, 3 August 2026; earnings per share Rp344 and net profit to owners Rp4.00tn from the FY2025 Annual Report [1]; market cap = Rp2,210 x 11.63bn shares.
JPFA's 11.63 billion shares at Rp2,210 give a market capitalisation of about Rp25.7tn against FY2025 net profit to owners of Rp4.00tn and earnings per share of Rp344 [2]. That is 6.4x reported FY2025 earnings. Because the first quarter of 2026 ran well ahead of the prior year, trailing-twelve-month earnings per share is nearer Rp442, which pulls the trailing multiple down to about 5.0x; consensus of Rp383 for FY2026 puts it at 5.8x forward. The shares are down roughly 17% from about Rp2,670 in early February and sit below their end-2025 level, so the multiple is falling on rising, not falling, earnings.
Against book value the picture is less dramatic. Total equity was Rp20.0tn at the end of 2025, of which Rp1.36tn belongs to non-controlling interests, leaving about Rp18.7tn attributable to JPFA's own shareholders [3]. At Rp25.7tn the shares trade at about 1.4x that equity — a fuller multiple than the P/E, because the P/E is being flattered by a return on equity (21.4% in FY2025) near the top of the cycle. Which of those two lenses is right depends on how durable the earnings are — the question the Segment Economics tab framed and this one prices.
A discount the whole sector wears
The instinct on a 6x P/E is to look for a company-specific reason the market is wrong. For JPFA, the more accurate starting point is that the market applies the low multiple to the whole Indonesian poultry sector. CPIN — the largest and best-capitalised of the group — offers the clearest record of the shift: it commanded 20–35x earnings through 2016–2023 and has since compressed to the low teens on 2025 earnings and roughly 7x trailing today.
Source: CPIN annual price-to-earnings ratios per market data (companiesmarketcap.com); trailing P/E of about 7x as of 3 August 2026 per market data.
The re-rating down has several plausible causes — the sector's cyclicality became undeniable after the 2022–2023 trough, the growth premium that once attached to a structural-consumption story faded, and Indonesian small-caps broadly de-rated. Whatever the mix, the effect is that a single-digit multiple is now the sector's resting state, not a JPFA anomaly. Within that band, the multiples line up by size and balance-sheet quality.
Sources: trailing P/E, price-to-book and dividend yield per market data, 3 August 2026 (StockAnalysis for IDX names; CPF ratios per market data). Market caps for IDX names in Rupiah trillion; CPF is Thailand-listed (THB) and shown for multiples only. JPFA P/B derived from shareholders' equity of Rp18.7tn [4].
The ladder is orderly. CPIN, the largest and least-levered, carries the highest multiple at about 7x trailing and 9x forward. JPFA sits below it at roughly 5x trailing. Malindo — the smallest and most volatile of the listed integrators — trades at about 3x. The regional cross-check, Thailand's Charoen Pokphand Foods, trades near 7x earnings and below book value at 0.8x. Nothing in this group is expensive; JPFA is neither the cheapest nor the dearest.
Why JPFA sits below the leader
The gap between JPFA at ~5x and CPIN at ~7x is not noise — it maps to real differences a buyer is entitled to discount for.
The first is the balance sheet. CPIN runs with modest leverage — roughly Rp2.7tn of net debt against Rp35.9tn of equity, a net-debt-to-equity ratio around 8% — and market forecasts have it moving to a net-cash position within a couple of years. JPFA carries about Rp8.3tn of net debt against Rp20.0tn of equity, and its US$350m Sustainability-Linked Bond fell due in March 2026, a maturity the Financials and Estimates tab showed pushed the current ratio to its weakest of the three years. The bond looks funded, but a levered cyclical is always worth less per unit of peak earnings than a near-unlevered one.
The second is mix and independence. CPIN's earnings lean more heavily on the stable, higher-return feed business; JPFA's profit swings more with the broiler and breeding layer, as the Segment Economics tab quantified. And JPFA sources a large share of its feed raw material through Annona Pte Ltd, an affiliate of its controlling group — a related-party channel the Ownership and the Parent tab found aligned but unbenchmarked. A minority buyer pays less for earnings that pass through a related party at a price they cannot independently verify.
The third is the control overhang. With the Santoso family holding 55.4% through a parent that was itself taken private and delisted in 2025, JPFA is now the only listed window into the group. That concentration cuts both ways — aligned incentives, but a standing question about minority treatment if the controller ever moved to consolidate. None of these three is fatal; together they explain why the market pays a leader's premium to CPIN and a discount to JPFA, and they are the levers a re-rating would have to move.
Which earnings you capitalise
The multiple a reader lands on depends on which year's earnings they treat as normal. JPFA's operating margin has ranged from 4.3% at the 2023 trough to 11.7% at the 2016 peak, averaging about 8.3% across the decade; FY2025's 10.2% sits in the upper part of that band [5]. Capitalise a mid-cycle 8% margin on FY2025 revenue and net profit to owners falls to roughly Rp3.0tn, or about Rp260 per share — and the multiple the reader is really paying rises accordingly.
Source: derived — Rp2,210 share price divided by earnings per share on each basis; reported EPS Rp80/Rp344 and revenue/margin from the FY2025 Annual Report [6]; mid-cycle EPS assumes an 8% operating margin on FY2025 revenue.
Left to right, the chart frames the valuation debate. If FY2023's trough is the true through-cycle earnings power, JPFA is expensive at nearly 28x. If the trailing figure — flattered by a hot first quarter — is durable, it is 5x. The mid-cycle estimate of about 8.5x is the most defensible anchor: it is what the stock costs on the decade's average margin rather than the trough or the peak. That is a reasonable, not a compelling, price for a controlled cyclical with a related-party input channel.
Consensus takes the more optimistic side. Thirteen analysts rate the stock Strong Buy with a mean target of Rp3,168, about 43% above the current price. At that target the shares would fetch roughly 8.3x FY2026 consensus and about 12x the mid-cycle earnings estimate — a level that requires both that earnings hold well above mid-cycle and that the sector multiple recovers some of the ground it lost. The target is a bet on the durable-earnings case the bulls make; it is not what today's price assumes.
Margin of safety
The downside is bounded more by the balance sheet and the dividend than by the multiple. On the mid-cycle earnings estimate the shares are about 8.5x — not a level that needs a re-rating to avoid loss, but not the deep discount the headline 5x suggests either. The 6.5% trailing dividend yield offers some support, but it is not a fixed coupon: JPFA's payout policy runs at roughly 35–55% of earnings and tracks the cycle, so in a trough year like 2023 (EPS Rp80) even a full payout would yield closer to 1.5% at today's price. The yield moves with the same margin that drives earnings.
The evidence points to a stock that is genuinely cheap on peak earnings and reasonably — not aggressively — priced on normalised earnings, carrying a discount that is mostly the sector's and partly its own for reasons a careful buyer would keep. The strongest fact against a bullish read is that FY2025's 10.2% margin sits near the top of the decade's range, so the base case should assume some mean reversion rather than extrapolate the record. The read would change if the mid-2026 half-year statement showed the feed and broiler margins holding into a second year — evidence that the supply-managed cycle has lifted mid-cycle earnings power structurally, which would make even 8x normalised earnings look low — or, on the other side, if the margin began reverting toward the 6–8% band while the sector multiple stayed compressed, which would leave today's price fair rather than cheap.
For a buyer whose case rests on a wide margin of safety, the Santosa family's 55.4% stake is both the alignment the thesis leans on and its sharpest governance risk. In 2025 the family took the group's Singapore parent private at roughly net asset value, and JPFA is now the only listed window into the franchise. This chapter asks what that leaves a public holder: how genuinely dispersed the float is, what a take-out of JPFA might cost, and what actually protects the minority.
The alignment cuts both ways
Ownership and the Parent established the facts of control: Japfa Pte Ltd owns 55.4%, executive equity is negligible, and the pay is modest. The skin in the game is real, and for a value investor that is the attraction. But the same control block is the risk a margin-of-safety buyer has to price, because the entity making capital-allocation decisions above JPFA has just shown, at the parent level, exactly what it does when it thinks a listed vehicle is worth more in private hands.
The family is aligned on the dividend stream, pro rata. What a public holder has to weigh is what happens to the 43.8% public float if the family concludes that JPFA, like its Singapore parent, is worth owning outright. That is a special-situation question, and the evidence to answer it is on the page.
Control has moved to the next generation
What changed in 2025 sits one level up, and it points in one direction: consolidation. The family took Japfa Ltd private and delisted it from the Singapore Exchange through joint offerors TAC 1 and TAC 2 — vehicles owned by Renaldo Santosa, Gabriella Santosa and Rachel Anastasia Kolonas, the founder's children — at S$0.62 a share in cash. In the January 2025 scheme announcement the offerors put the terms plainly: a 34.8% premium to the last traded price but only about 12.7% above the parent's net asset value at 30 September 2024, with the controlling shareholders already holding 81.67% and the scheme extended to the 18.33% they did not own. Independent shareholders approved it in April 2025 and the delisting followed in mid-2025, as reported by the SGX filing and Reuters.
Two things carry over to JPFA. First, it is now the family's only listed asset — the sole place a public investor can own this poultry franchise, which raises JPFA's strategic value to the family whether they keep it public or not. Second, the same next generation now sits directly on JPFA's board: the April 2025 AGM appointed Gabriella Santosa — one of the three parent offerors — as a Director, replacing Antonius Harwanto Suryo Sembodo, who moved up to Commissioner [1]. The people who took the parent private are now inside the operating company's boardroom.
The float is thinner than 43.8%
The headline free float is 43.8% [2]. The register underneath it is less dispersed than that number suggests. Behind Japfa Pte Ltd's 6.50 billion shares, the next-largest holders are a cluster of Singapore private-bank custody accounts — Standard Chartered / VP Bank for "Tree of Blessing Pte. Ltd." (4.4%), Bank Julius Baer (3.4%), Union Bancaire Privée (3.2%) and UBP for "Success Joy Trading Limited" (3.0%) — followed by a named member of the controlling family, Mieke Santosa, holding 2.2% outside the parent vehicle [3].
Source: FY2025 Annual Report, Top 20 Shareholders as of 31 December 2025; "global funds" and "other public" are the author's grouping of the remaining top-20 lines and the residual float [4].
Those four private-bank blocks total about 14% of all shares — roughly a third of the entire public float — and the register does not disclose who beneficially owns them. They could be independent high-net-worth investors, or holdings adjacent to the control group; the filing does not say, and I will not guess. But the point stands either way: recognizable arms-length money — the iShares, Vanguard, DFA, Norges and CalPERS lines — each holds well under 1%, while a handful of opaque custody vehicles hold multiples of that. The genuinely transparent, dispersed float is nearer 28% than 44%. That matters because, under Indonesian rules, it is the independent minority — not the headline free float — that decides whether a going-private succeeds.
What a take-out would cost
JPFA's book value is the anchor. Equity attributable to the parent's owners was Rp18.66 trillion at end-2025 [5]; across the 11.63 billion shares outstanding that is about Rp1,605 a share. At today's Rp2,210 the stock trades near 1.4 times book — and in June 2026 it briefly touched Rp1,780, about 1.1 times book, so the market has recently tested levels close to net asset value on its own.
This bears directly on a margin-of-safety buyer. The family's revealed preference at the parent was to take minorities out at roughly net asset value — 12.7% above NAV. JPFA, unlike the holding company, trades above its book value, so a take-out struck on the same NAV logic would land below today's price. Indonesian pricing rules push the other way: a voluntary tender or buyback price is referenced to recent market trading, not to book, so a real bid would more likely have to clear a premium to the prevailing share price — as the parent deal did, at 34.8% over its last trade. The honest read is a wide range, shown below, with the downside case sitting under the current quote.
Source: illustrative — derived from FY2025 equity of Rp18.66tn / 11.63bn shares [6] and the parent's disclosed scheme terms; not a forecast that any bid will occur.
The direction of that asymmetry is what matters at entry. Buying above book means the reference case a controller could argue for — net asset value — is a level below the entry price, not above it. Here JPFA's ~1.4x book, cheap as it looks against earnings, is not a margin of safety against a take-out, because it is the gap a NAV-referenced bid would close against the minority.
What protects the minority
The protection is procedural, and it is not trivial. Indonesia's going-private regime — OJK Regulation No. 3/POJK.04/2021, with voluntary tender offers under No. 54/POJK.04/2015 and buybacks under No. 29/2023 — requires that a delisting be approved at a general meeting where only independent shareholders vote; the controlling shareholder is excluded from the count, and dissenting holders can require the company to buy their shares at a price set by an independent appraiser. With a genuinely independent float and an appraisal floor, a lowball squeeze-out is not a free option — it is a negotiation the minority has standing in. The thinness of that "independent" float, and the opacity of the private-bank blocks that make up a third of it, are what would decide how much that standing is worth in practice.
Two smaller facts round out the current posture, both mildly reassuring. There is no ongoing dilution of minorities through management equity: the Performance Share Plan has gone dormant — "in 2025, the Company did not implement a Performance Share Plan programme" [7]. And the standing buyback mandate is modest and disclosed: the 2025 AGM authorized repurchases of up to 2% of shares, for uses including resale, the share plan, convertible financing or capital reduction [8]. One historical mark worth keeping in view: the company has, before, moved stock toward the parent at its own discretion: in 2018 it sold 12,696,740 treasury shares directly to Japfa Ltd [9]. Small in itself, but it shows the direction treasury stock has historically travelled.
The read
On the evidence, the take-private risk is real but not imminent, and the balance of facts is closer to "watch" than "avoid." A going-private needs an independent-shareholder vote and an appraiser's price, JPFA is the family's only listed asset — which is a reason to keep it public and liquid — and there is no visible squeeze-out preparation today. The strongest fact on the other side is the parent precedent itself: the same three family members who now sit closer to JPFA's board took minorities out one level up at barely a premium to net asset value, and JPFA trades above book, so the reference point a controller would reach for sits below the current price. What would change the read, in either direction: an unusual treasury buildup or a jump in the 2% buyback mandate; any related-party move that shifts value ahead of a corporate action; or, reassuringly, a re-rating that lifts the stock so far above book that a NAV-referenced take-out becomes implausible. For a buyer who likes a strong promoter and a low price, the strong promoter is both the reason to own the stock and the reason to read the fine print.
Every load-bearing fact is now on the page; the full through-line runs through Company and Cycle. This chapter delivers no verdict — it lays the two readings over one shared set of facts, isolates the variables that decide between them, and names what to watch. The cheapness and the risk share a single source. At Rp2,210 JPFA is ~6.4x record and only ~8.5x mid-cycle earnings because its whole margin cycle sits in one commercial-farm unit that swung from a Rp611bn loss in 2023 to a Rp1,796bn profit in 2025 — a ~46%-of-poultry-profit layer whose FY2024-25 recovery the company credits to government import quotas and culling — while the feed margin barely moved from 8.2% to 8.7%.[14][13]
Cashing that out: an 8% mid-cycle operating margin on FY2025 revenue (~Rp60.7tn) yields ~Rp260 EPS, about 24% below the Rp344 record, which lifts the multiple from ~6.4x to ~8.5x at Rp2,210 — reasonable, not compelling. The counter-fact sits in the same place: government supply management (import quotas, culling) may have structurally lifted the through-cycle floor, so FY2024-25's ~10% margin could be closer to the new normal and ~6x the right multiple — the April 2025 culling had no material adverse impact, and 1Q2026 profit ran ~2.7x YoY. The segment figures are drawn from Segment Economics and the multiple ladder from Valuation and Peers; the balance sheet, importantly, caps the downside either way.
The facts both sides accept
Bull and bear here do not dispute the numbers. They dispute what the numbers mean. The ledger they share follows.
| Fact | Figure | Source |
|---|---|---|
| FY2025 revenue | Rp60.7tn | [1] |
| FY2025 profit to owners / EPS | Rp4.00tn / Rp344 | [2] |
| FY2025 operating margin | ~10.2%, near the decade top (10-yr avg ~8.3%) | [3] |
| 1Q2026 net sales / profit | Rp17.71tn (+23.6%) / ~2.7x YoY | [4] |
| US$350m Sustainability-Linked Bond | 5.375% Senior Notes, matured 23 Mar 2026, rated B+ | [5] |
| Consensus EPS FY2026-28E / target | Rp383 / Rp406 / Rp424 / Rp3,168 | [6] |
| Price / trailing multiple / P/B | Rp2,210 / ~6.4x FY2025 EPS / ~1.4x book | [7] |
Shared-fact ledger for the debate; sources as cited. See Financials and Estimates and Valuation and Peers for the full workings.
The same facts, read two ways
The bull reads a mispriced compounder. Revenue has risen every year for a decade; the cyclicality lives entirely in a few points of margin, not in demand [8]. The balance sheet is the strongest it has been through the cycle, and the near-term liability that worried the tape — the US$350m bond — has now passed its 23 March 2026 maturity, entered already reclassified as current and pre-funded [9]. Consensus does not model a rollover: it models a plateau at Rp383-424 [10], and 1Q2026 came in ahead of it, with profit up roughly 2.7x [11]. At ~6.4x record earnings and ~1.4x book, for a founder-controlled franchise with 43.8% of the group already public, the market is paying a trough multiple for a business at a structural-demand inflection.
The bear reads a discounted peak. That 10.2% margin sits near the top of a decade whose average is ~8.3% [12], and a meaningful slice of the FY2024-25 record rests on a government supply lever: the company itself says broiler production "must be carefully maintained to prevent oversupply," and in April 2025 the Ministry of Agriculture directed the industry to cut fertile hatching eggs and early-cull parent stock [13]. Relax the lever and the commercial-farm unit — which swung from a Rp744bn loss in 2022 to a Rp1,796bn profit in 2025 — swings back [14]. On a mid-cycle 8% margin, EPS is closer to Rp260 and the ~6x cheapness becomes ~8.5x — reasonable, not a bargain. The low multiple, on this reading, is not a mistake; it is the market correctly refusing to capitalise a supply-managed peak.
What a single price implies
At today's Rp2,210, whether JPFA is cheap depends entirely on which earnings number you treat as normal.
| Which earnings you believe | EPS (Rp) | P/E at Rp2,210 |
|---|---|---|
| FY2023 trough (actual) | ~79 | ~28.0x |
| Mid-cycle (8% op margin) | ~260 | ~8.5x |
| FY2025 record (actual) | 344 | ~6.4x |
| Consensus FY2026E | 383 | ~5.8x |
| TTM through 1Q2026 | ~442 | ~5.0x |
Same price, five earnings assumptions. Trough EPS derived from FY2023 profit to owners (~Rp0.93tn) over ~11.7bn shares; mid-cycle from an 8% operating margin on FY2025 revenue per Valuation and Peers; actuals and consensus per [15] and [16].
The honest reading is that the truth is not at either extreme. Nobody should capitalise the FY2023 trough at today's price, and nobody should underwrite the TTM peak as perpetual. The debate that matters runs in the narrow band between mid-cycle (~8.5x) and consensus plateau (~5.8x) — and that band is decided by a short list of variables.
What actually decides it
| Swing variable | The bull needs | The bear needs | Where it stands |
|---|---|---|---|
| Broiler/DOC farm-gate vs feed cost | Supply controls hold; commercial-farm stays profitable | Oversupply returns as culling/quotas relax | Structurally oversupply-prone; policy-dependent [17] |
| Consensus plateau (EPS ~Rp400) | FY26-28 plateau is realised | Earnings roll toward mid-cycle ~Rp260 | 1Q2026 running ahead of plan [18] |
| Multiple re-rating | Sector re-rates off single digits | Cyclical distrust keeps it de-rated | 6.4x record vs ~8.5x mid-cycle [19] |
| Annona related-party channel | Stays an arm's-length pass-through | Price wedge widens against minorities | Passes the aggregate test; unbenchmarked on price [20] |
The four variables that move the read between the mid-cycle and plateau cases; detail in Segment Economics and The Annona Price Test.
The read is most sensitive to the first line — the durability of the commercial-farm profit, which is itself downstream of a supply-management policy that "can be relaxed as easily as tightened." That is where the bull and bear genuinely disagree about the world, not just about a multiple.
What to watch
The next hard evidence is dated and close. As of early August 2026 the 30 June 2026 half-year statement is not yet filed; when it lands it should show three things at once — whether feed's ~8% operating margin and, more importantly, the commercial-farm/breeding profit held through Q2; a clean settlement of the US$350m bond in the cash-flow and balance-sheet lines; and whether the Annona purchase share held or drifted. Between reports, the live cyclical read is Indonesian broiler and DOC farm-gate prices against feed cost, and whether the culling and import-quota controls persist into H2 2026 — controls that, on the historical record, have often failed to hold farm-gate prices above the government's own floor.
For a margin-of-safety reader
For an investor who demands a large margin of safety and a near-zero chance of ruin, the reassuring feature is that the downside is bounded by the balance sheet, not by the multiple. Total liabilities/equity of 1.0x, the strongest position through the cycle, and a dividend that flexes with earnings mean the bear case is lower returns and a re-rating that never comes — not insolvency [21]. The margin of safety here is the deleveraged balance sheet and the ~1.4x book value, held up by a franchise selling into ~8kg-per-capita poultry consumption against Malaysia's ~50kg [22] — not the headline P/E, which is largely the sector's discount rather than JPFA's own. What you are underwriting is a good balance sheet and a real demand runway while you wait to learn whether FY2025's ~10% margin holds or fades.